This Post will build incrementally as I find time. Please visit regularly to check for updates.
In Part 5, we compared recent years’ death rates in 31 countries to see whether 2020 was indeed a standout year. We found that for most countries, including Sweden, which was roundly criticised for not imposing harsh restrictions on its citizens, 2020 was about average mortality-wise.
This instalment covers each of those 31 countries in detail. A selection of countries that weren’t suitable for inclusion in Part 5 (as their data were not in a form that enabled direct comparison) will also be included here.
For each country, a collection of five graphs is provided. These may be useful aids when discussing the justification for lockdowns and other restrictions imposed in your own country. Each of the five graphs cover a specific age group: 0-14, 15-64, 65-74, 75-84, and 85+ years. Thus, together they cover the entire age-spectrum of the country’s population.
This is a very long post. To skip to a country of interest, choose it from the table below.
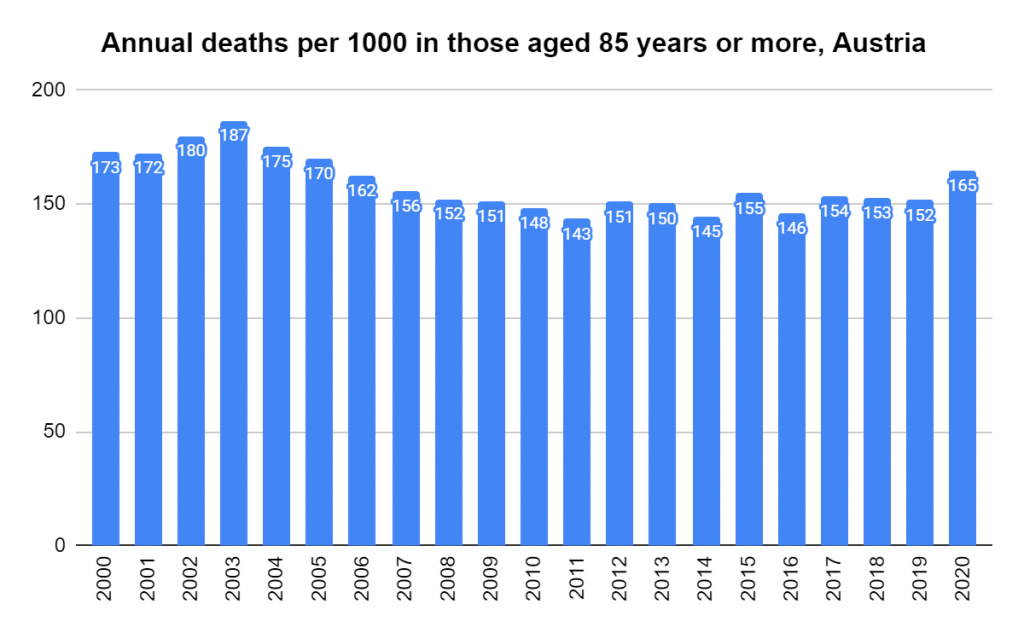
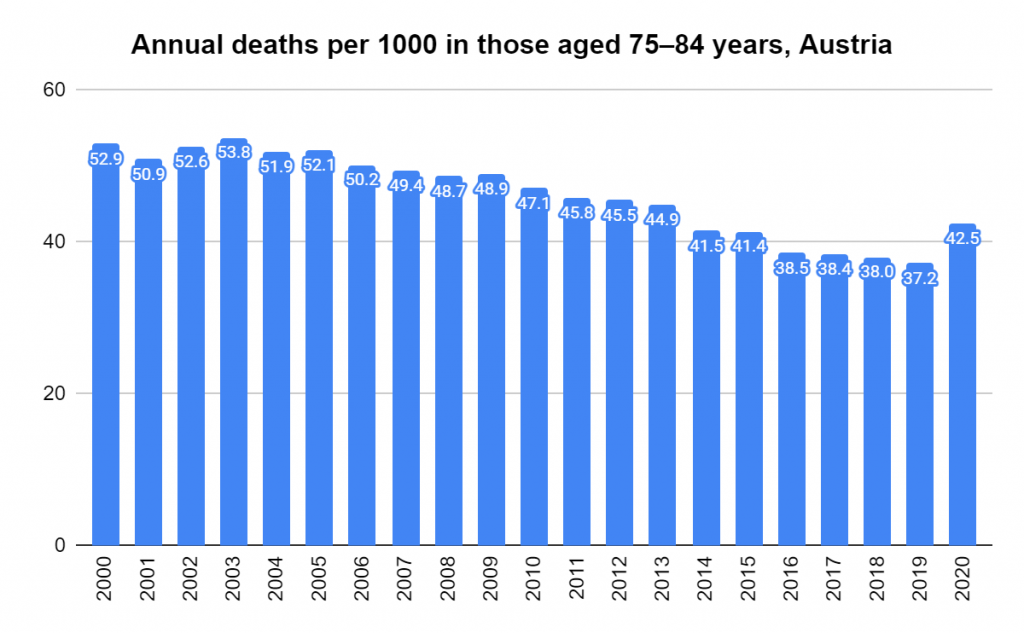
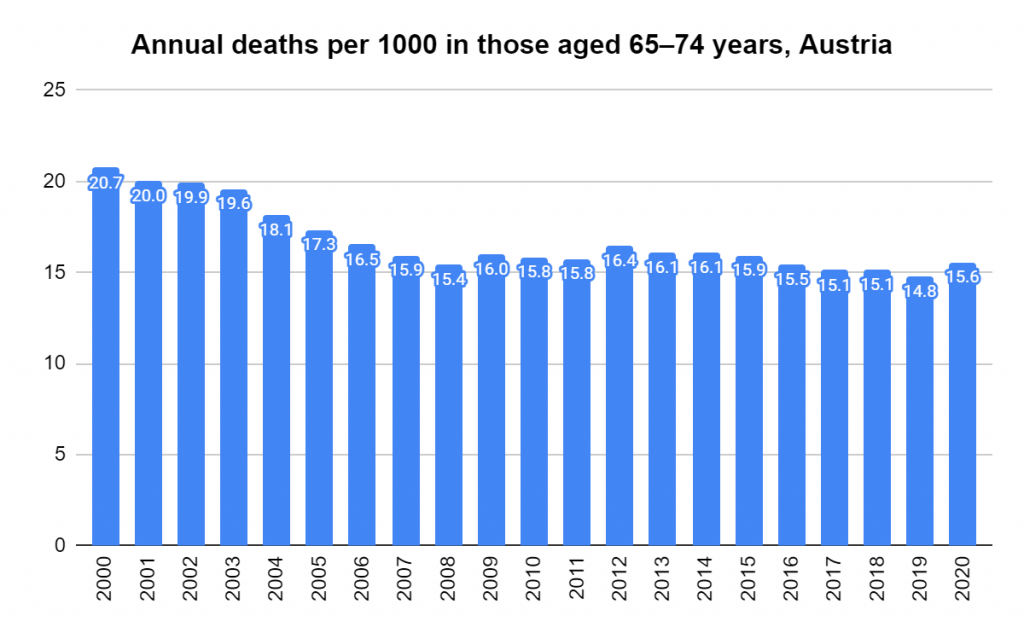
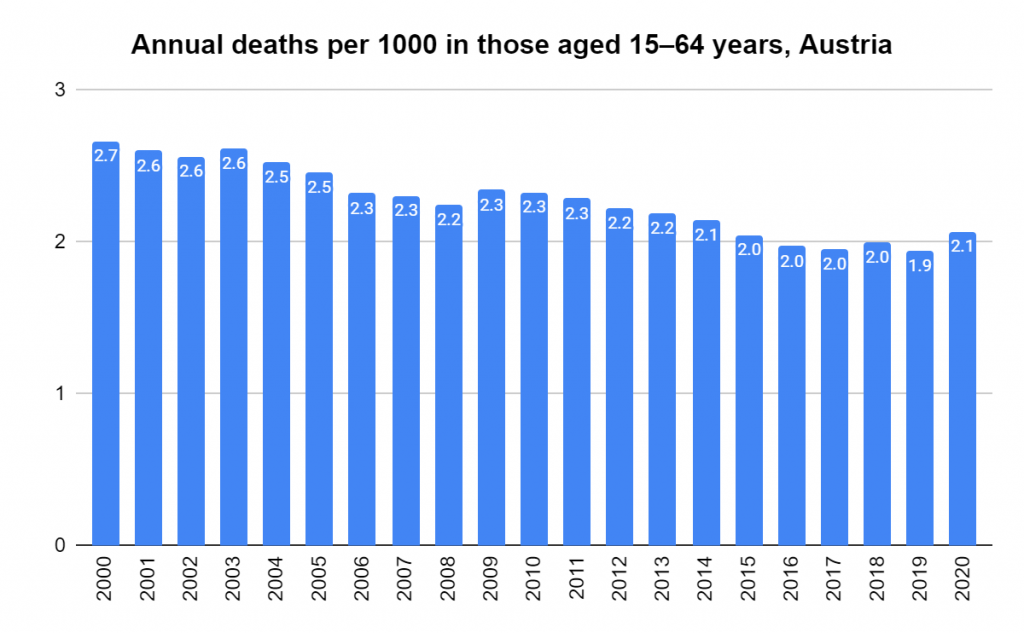
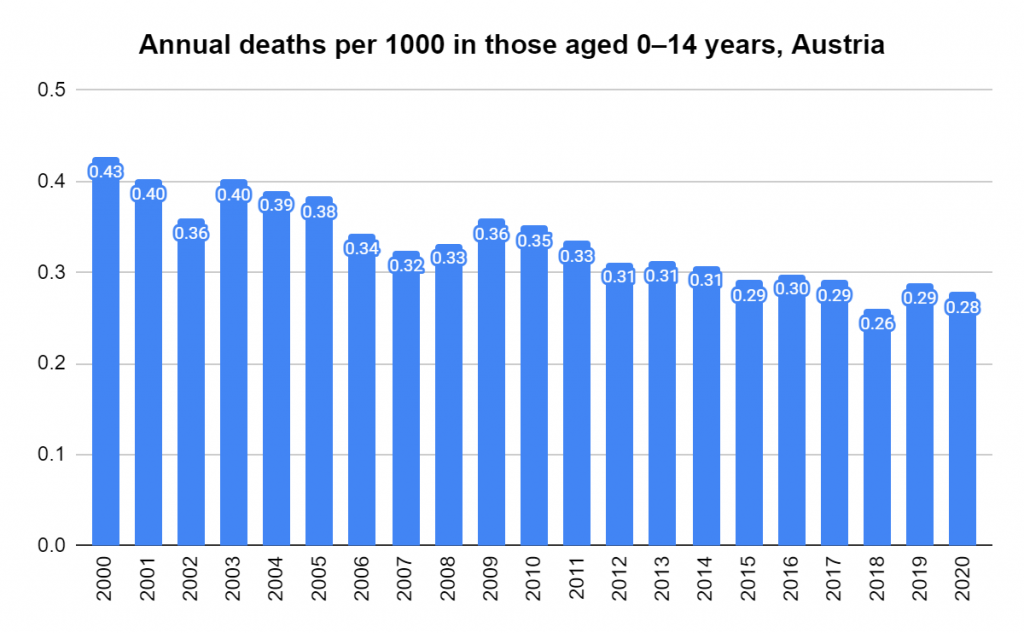
Figure 17. Deaths per 1000 per year in Austria, ages 85 and over. Derived using data from the Human Mortality Database. Calculations and methods.Figure 18. Deaths per 1000 per year in Austria, ages 75-84. Derived using data from the Human Mortality Database. Calculations and methods.Figure 19. Deaths per 1000 per year in Austria, ages 65-74. Derived using data from the Human Mortality Database. Calculations and methods.Figure 20. Deaths per 1000 per year in Austria, ages 15-64. Derived using data from the Human Mortality Database. Calculations and methodsFigure 21. Deaths per 1000 per year in Austria, ages 0-14. Derived using data from the Human Mortality Database. Calculations and methods.
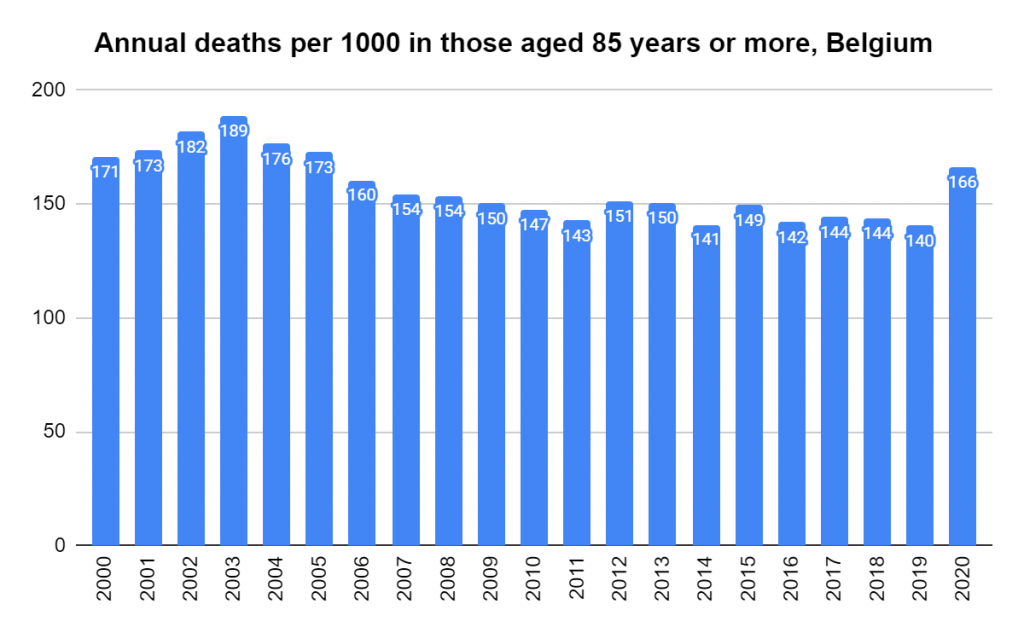
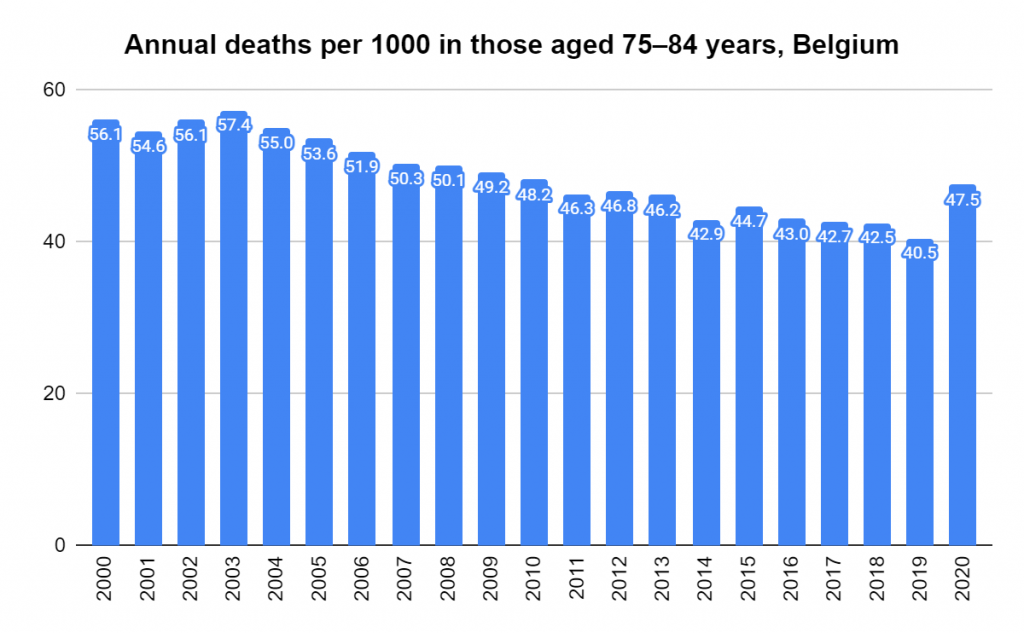
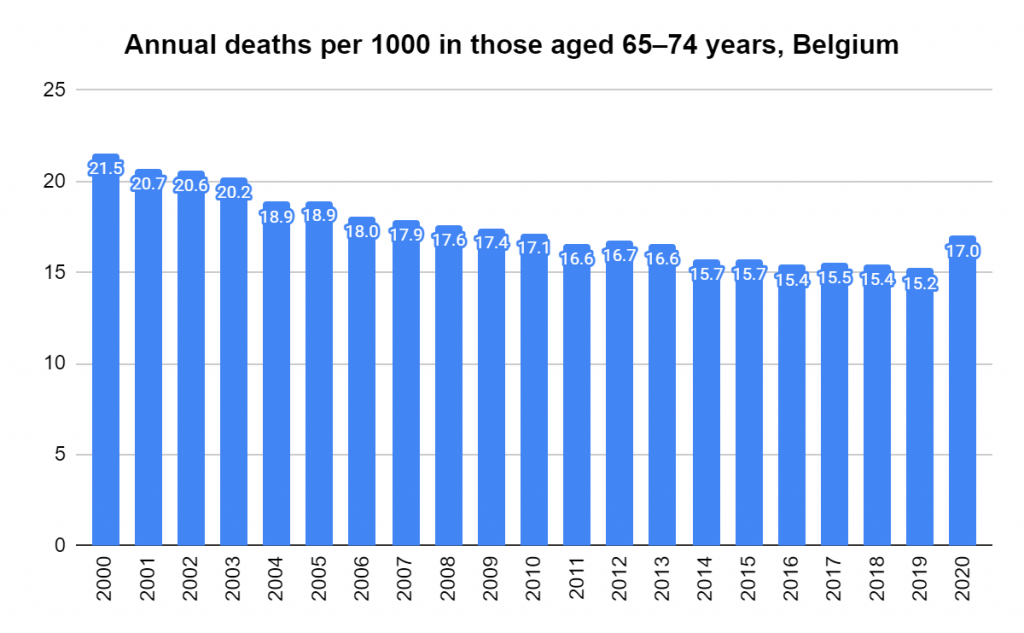
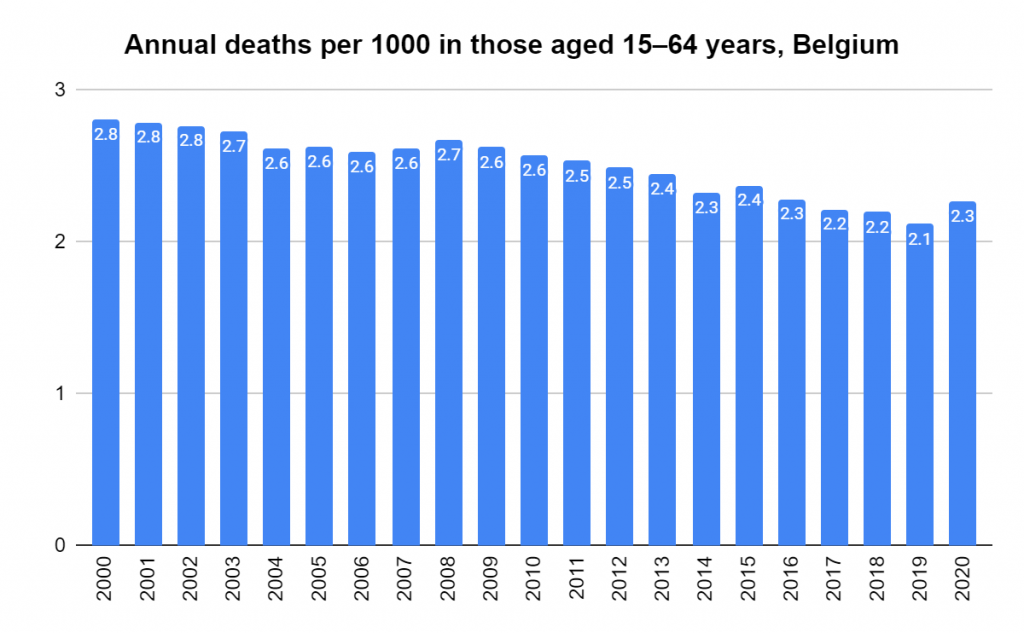
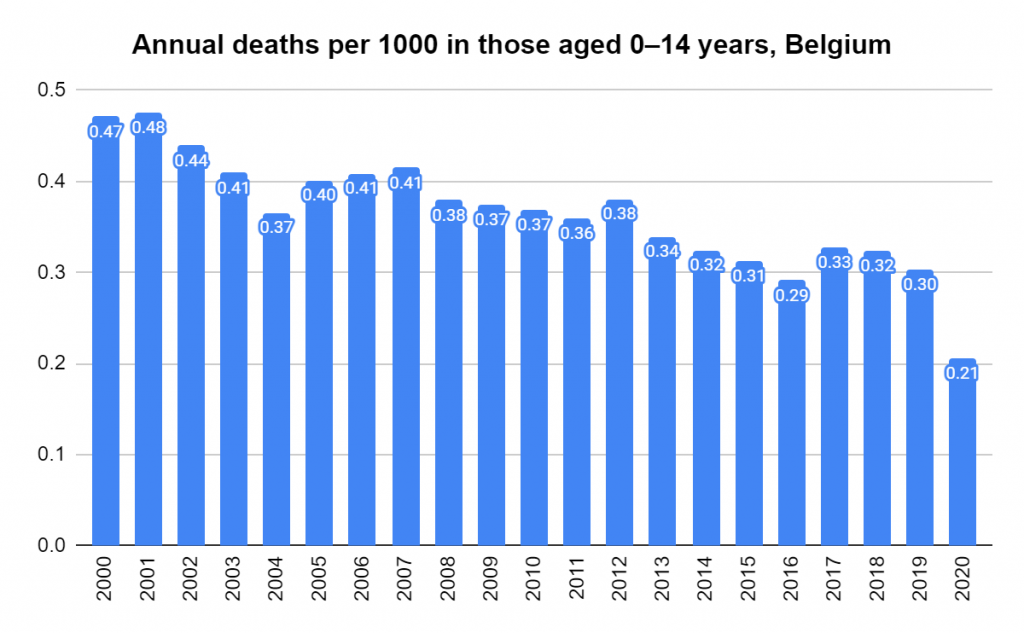
Figure 22. Deaths per 1000 per year in Belgium, ages 85 and over. Derived using data from the Human Mortality Database. Calculations and methods.Figure 23. Deaths per 1000 per year in Belgium, ages 75-84. Derived using data from the Human Mortality Database. Calculations and methodsFigure 24. Deaths per 1000 per year in Belgium, ages 65-74. Derived using data from the Human Mortality Database. Calculations and methodsFigure 25. Deaths per 1000 per year in Belgium, ages 15-64. Derived using data from the Human Mortality Database. Calculations and methodsFigure 26. Deaths per 1000 per year in Belgium, ages 0-14. Derived using data from the Human Mortality Database. Calculations and methods
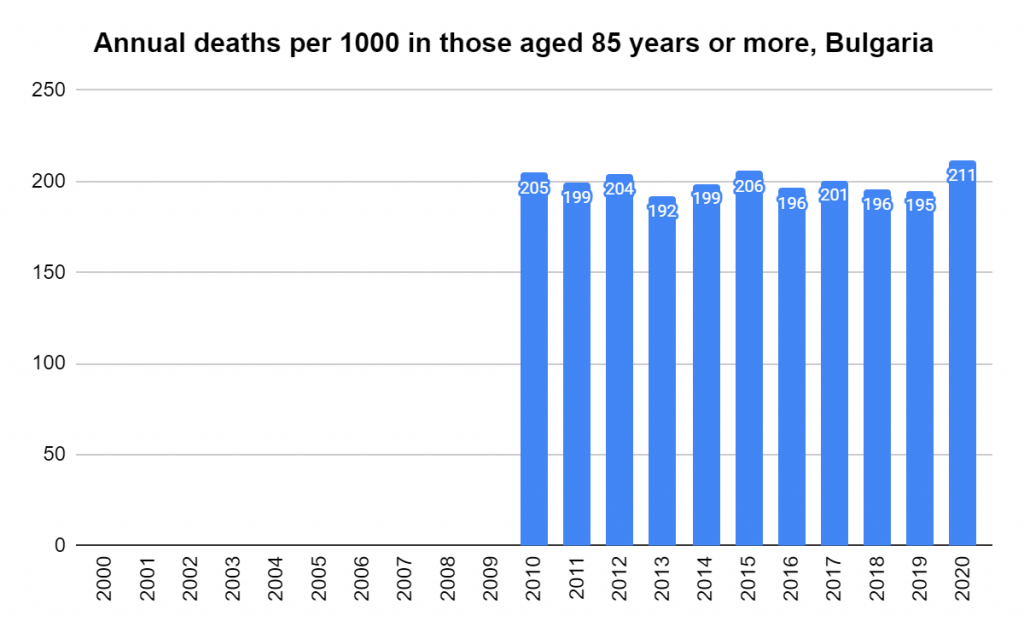
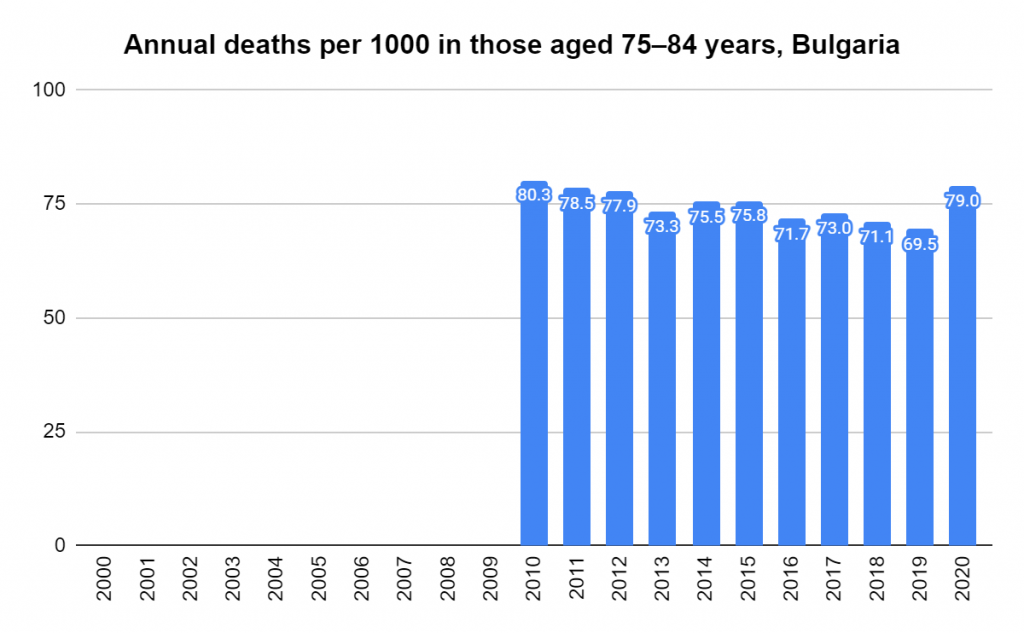
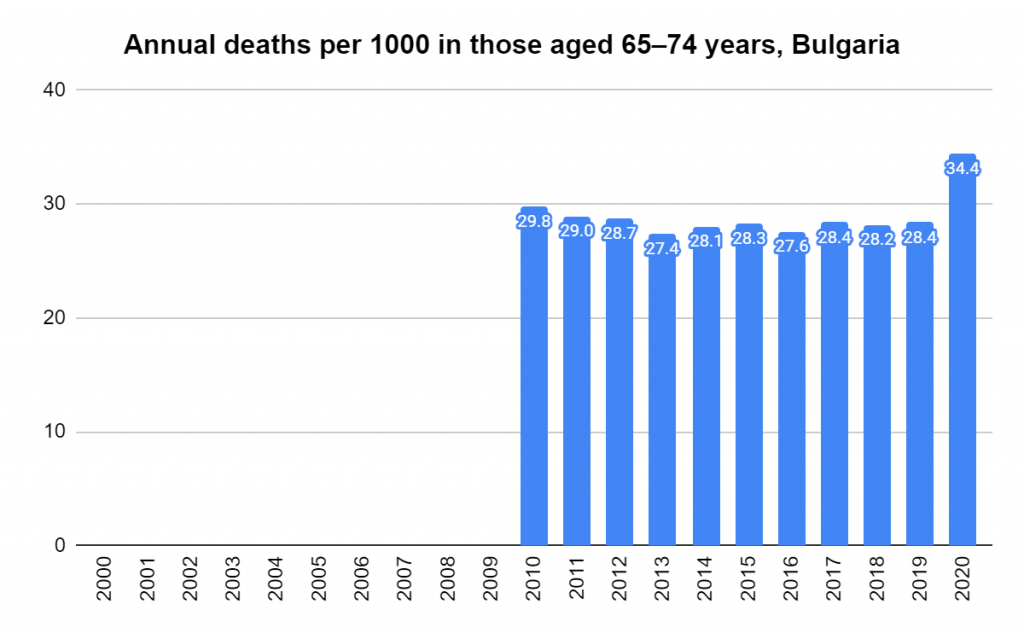
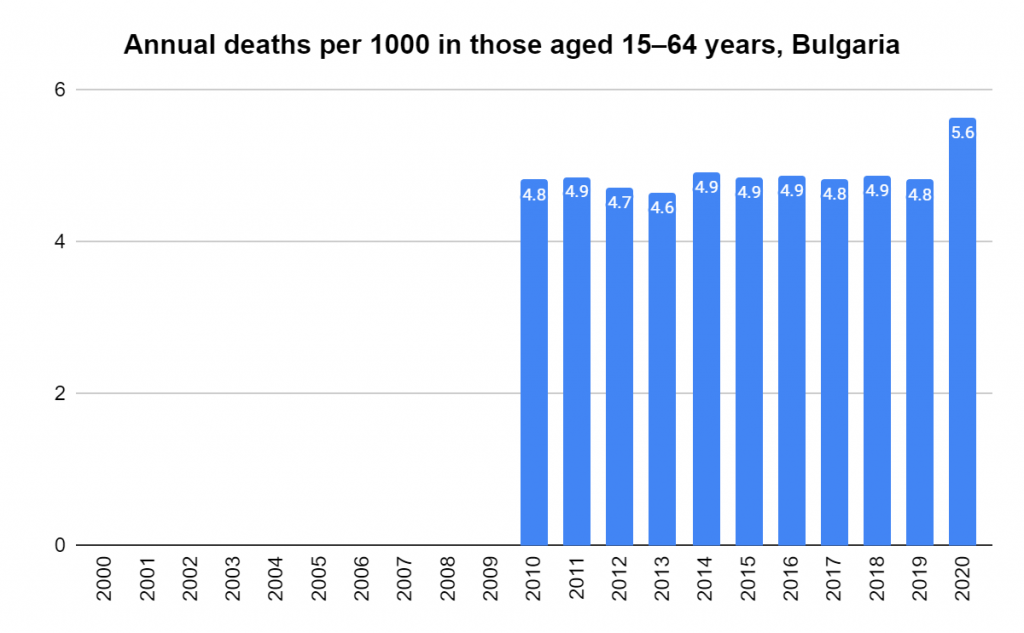
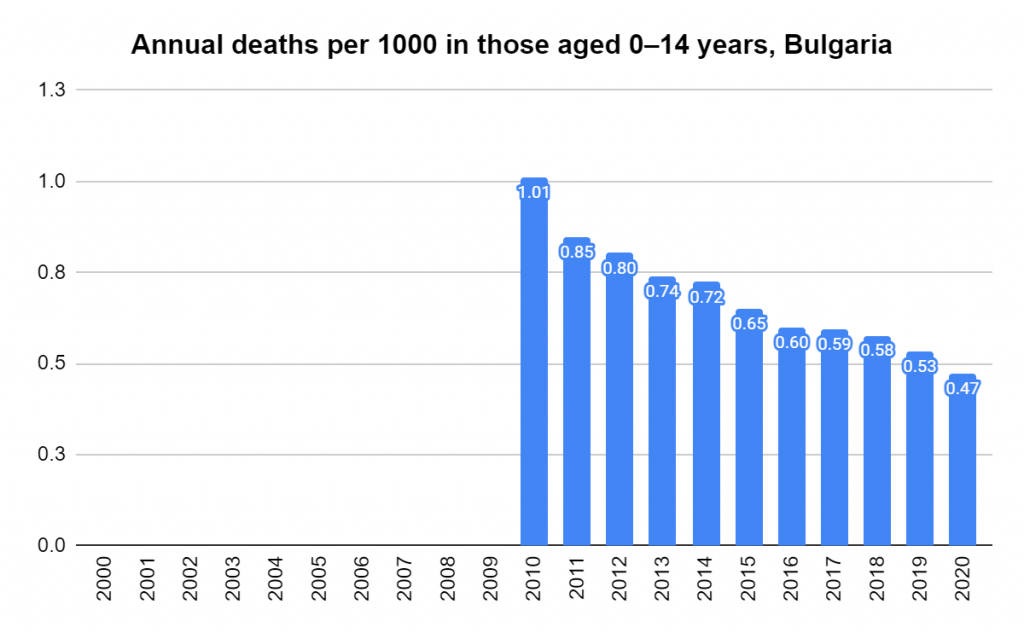
Figure 27. Deaths per 1000 per year in Bulgaria, ages 85 and over. Derived using data from the Human Mortality Database. Calculations and methodsFigure 28. Deaths per 1000 per year in Bulgaria, ages 75-84. Derived using data from the Human Mortality Database. Calculations and methodsFigure 29. Deaths per 1000 per year in Bulgaria, ages 65-74. Derived using data from the Human Mortality Database. Calculations and methodsFigure 30. Deaths per 1000 per year in Bulgaria, ages 15-64. Derived using data from the Human Mortality Database. Calculations and methodsFigure 31. Deaths per 1000 per year in Bulgaria, ages 0-14. Derived using data from the Human Mortality Database. Calculations and methods
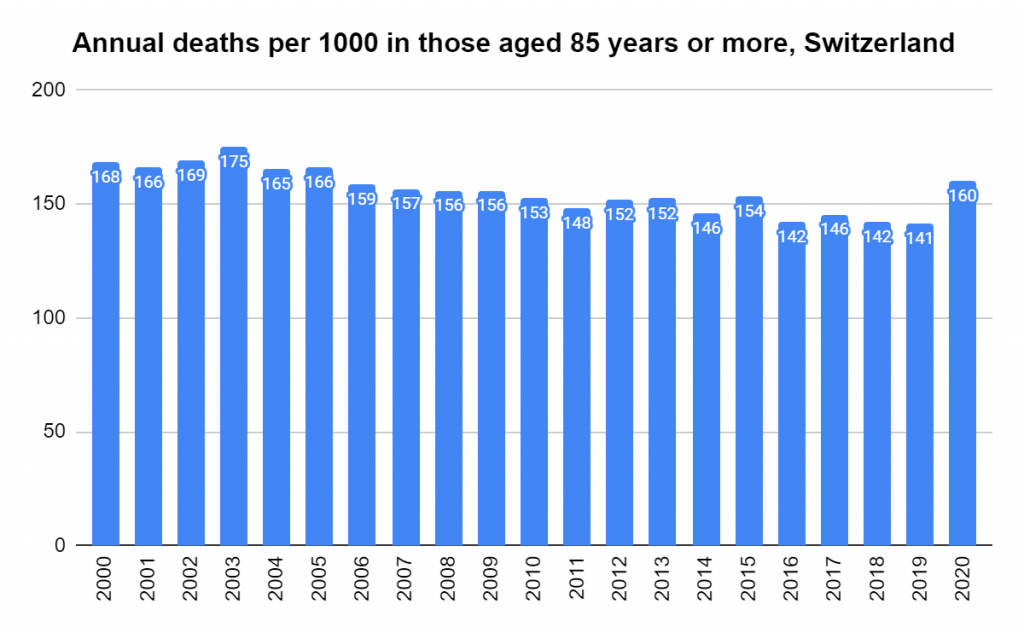
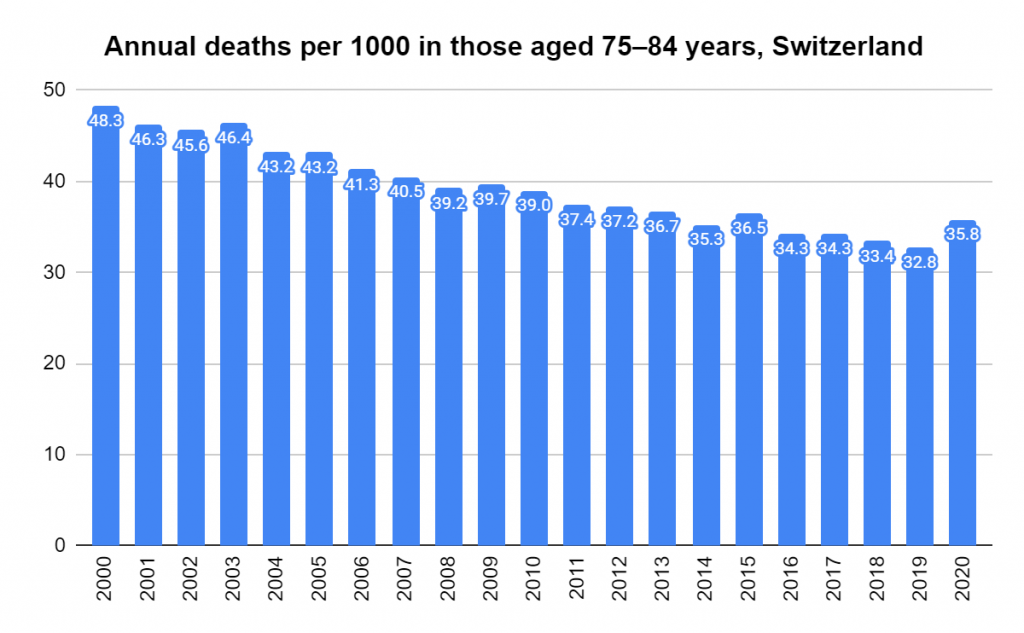
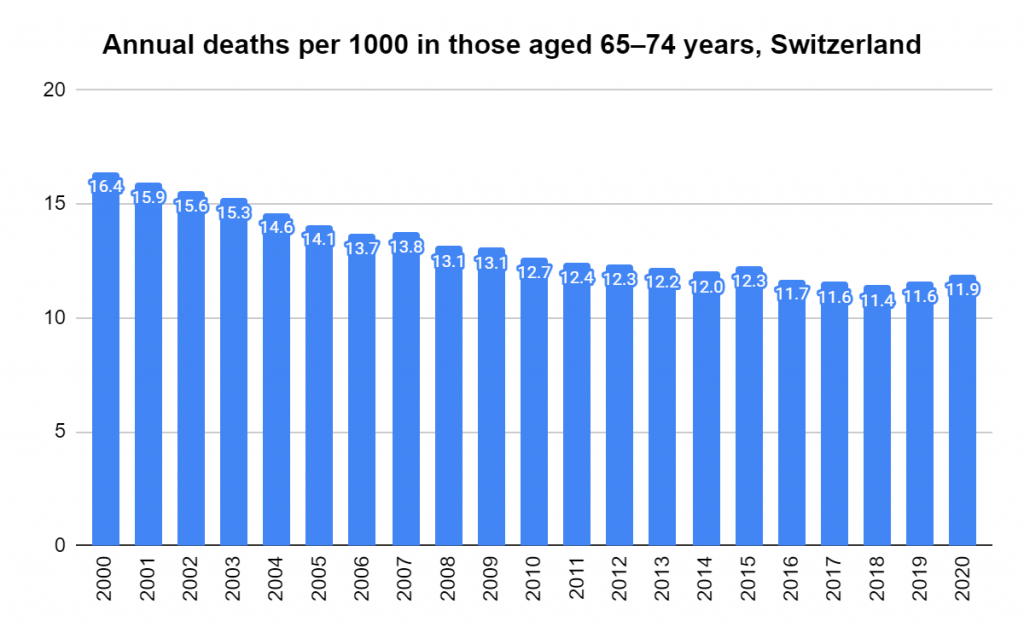
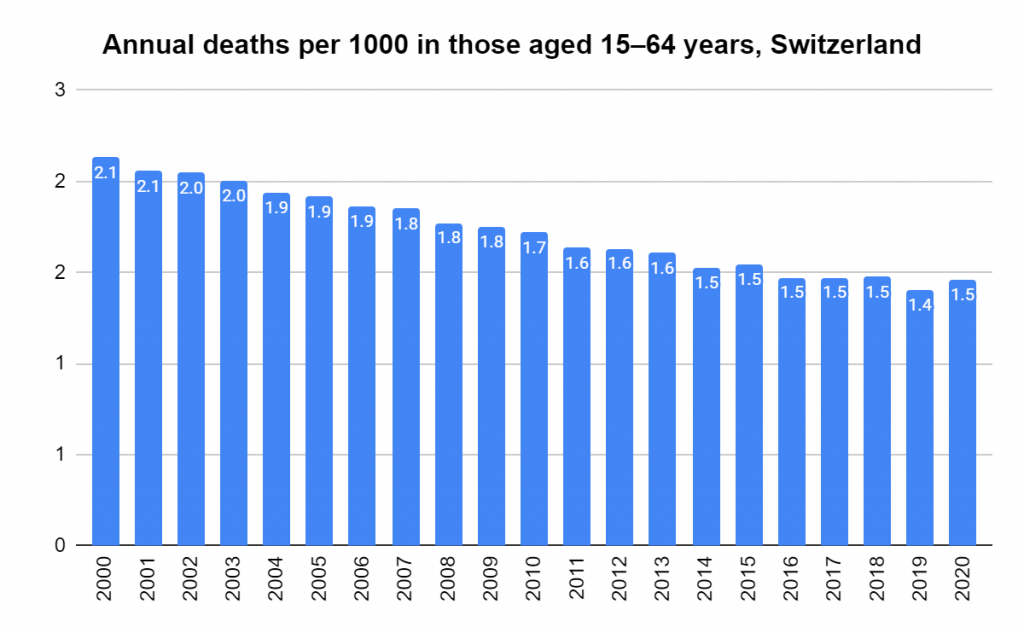
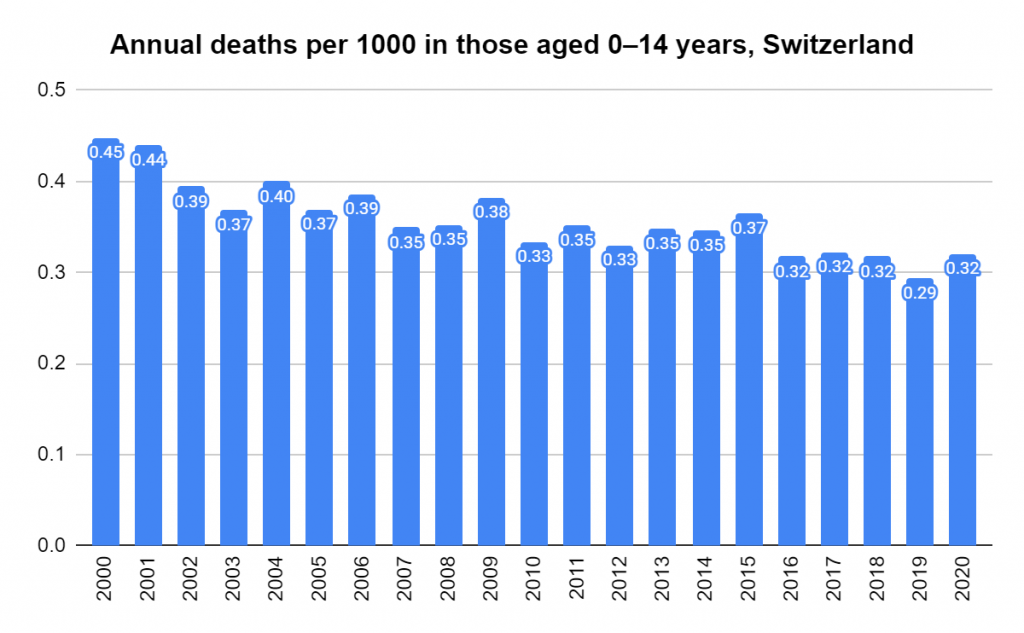
Figure 32. Deaths per 1000 per year in Switzerland, ages 85 and over. Derived using data from the Human Mortality Database. Calculations and methodsFigure 33. Deaths per 1000 per year in Switzerland, ages 75-84. Derived using data from the Human Mortality Database. Calculations and methodsFigure 34. Deaths per 1000 per year in Switzerland, ages 65-74. Derived using data from the Human Mortality Database. Calculations and methodsFigure 35. Deaths per 1000 per year in Switzerland, ages 15-64. Derived using data from the Human Mortality Database. Calculations and methodsFigure 36. Deaths per 1000 per year in Switzerland, ages 0-14. Derived using data from the Human Mortality Database. Calculations and methods
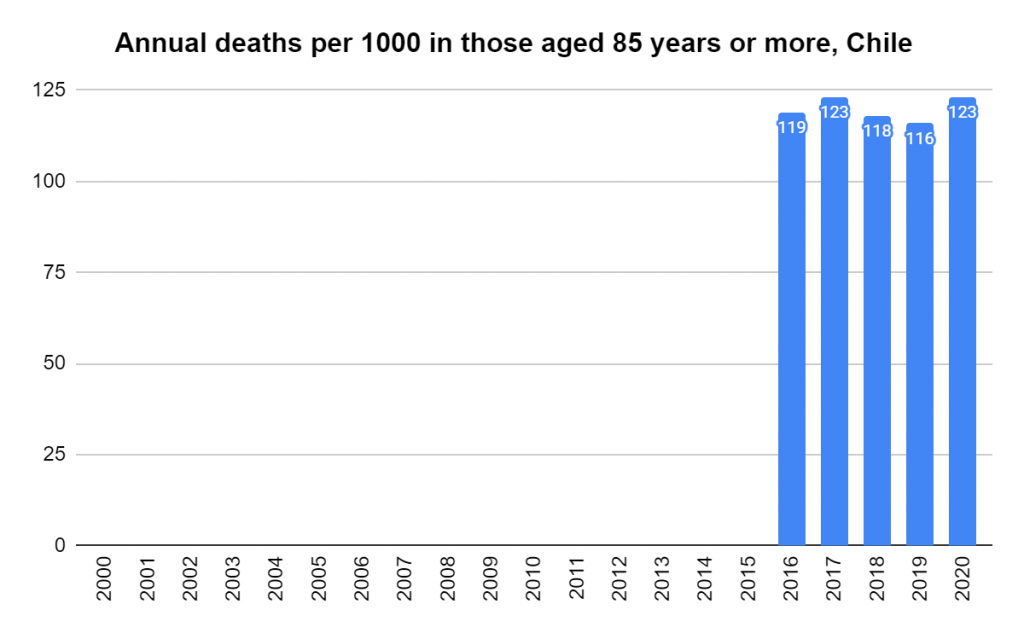
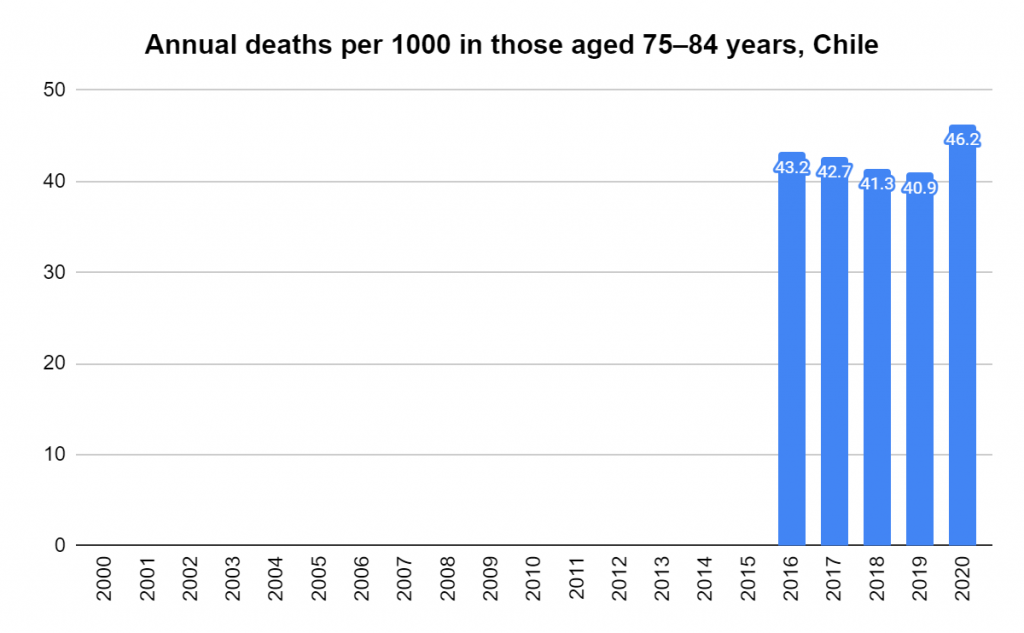
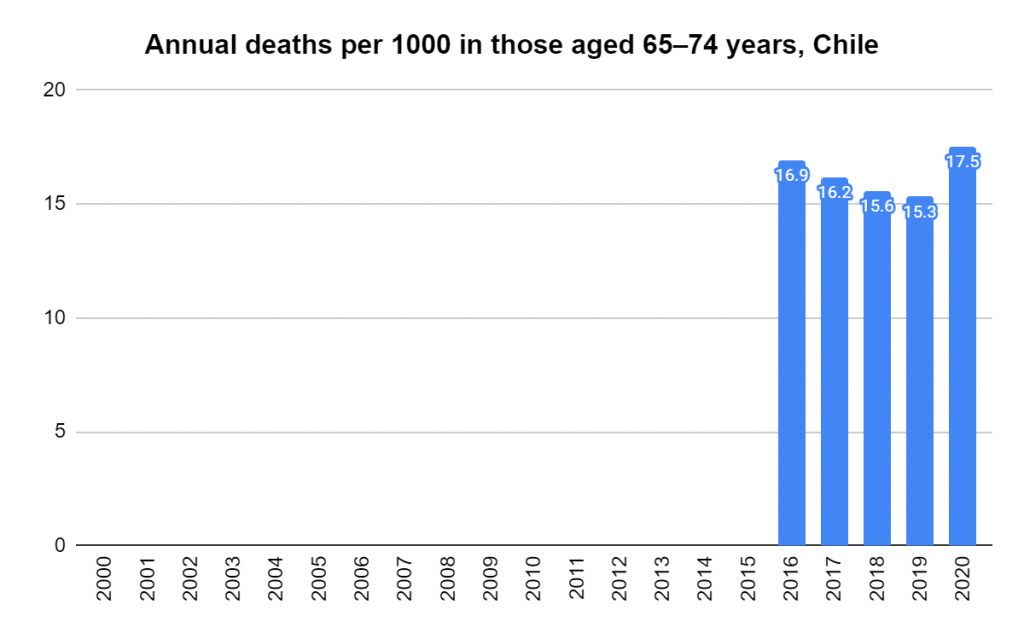
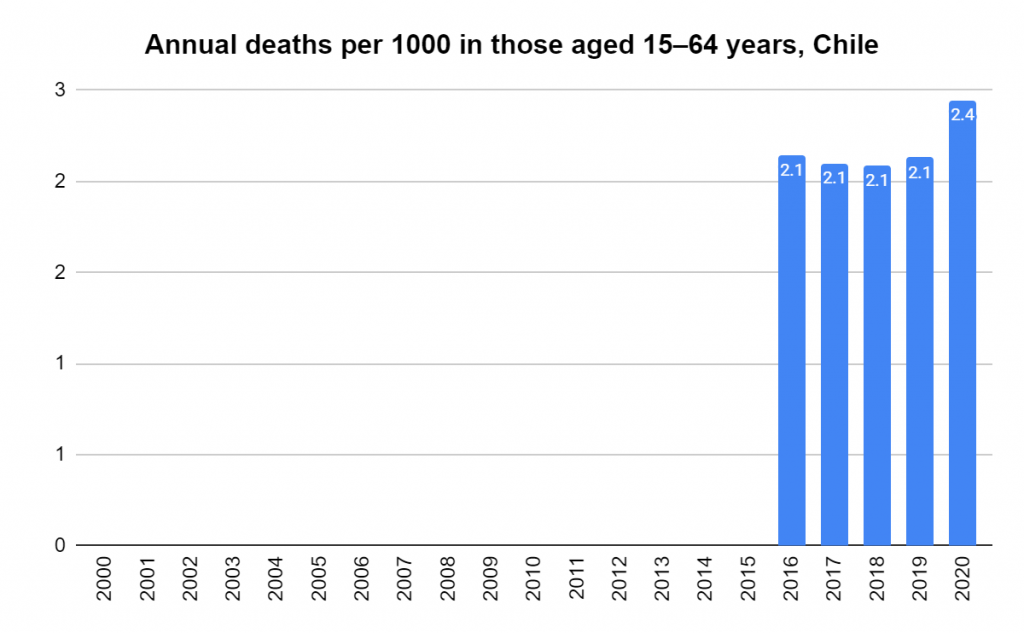
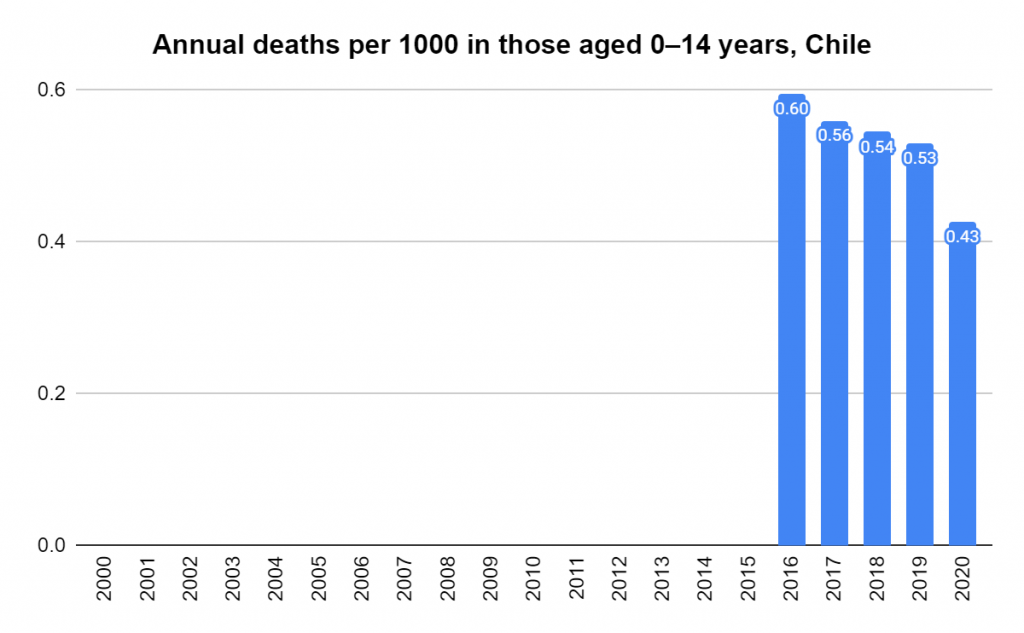
Figure 37. Deaths per 1000 per year in Chile, ages 85 and over. Derived using data from the Human Mortality Database. Calculations and methodsFigure 38. Deaths per 1000 per year in Chile, ages 75-84. Derived using data from the Human Mortality Database. Calculations and methodsFigure 39. Deaths per 1000 per year in Chile, ages 65-74. Derived using data from the Human Mortality Database. Calculations and methodsFigure 40. Deaths per 1000 per year in Chile, ages 15-64. Derived using data from the Human Mortality Database. Calculations and methodsFigure 41. Deaths per 1000 per year in Chile, ages 0-14. Derived using data from the Human Mortality Database. Calculations and methods
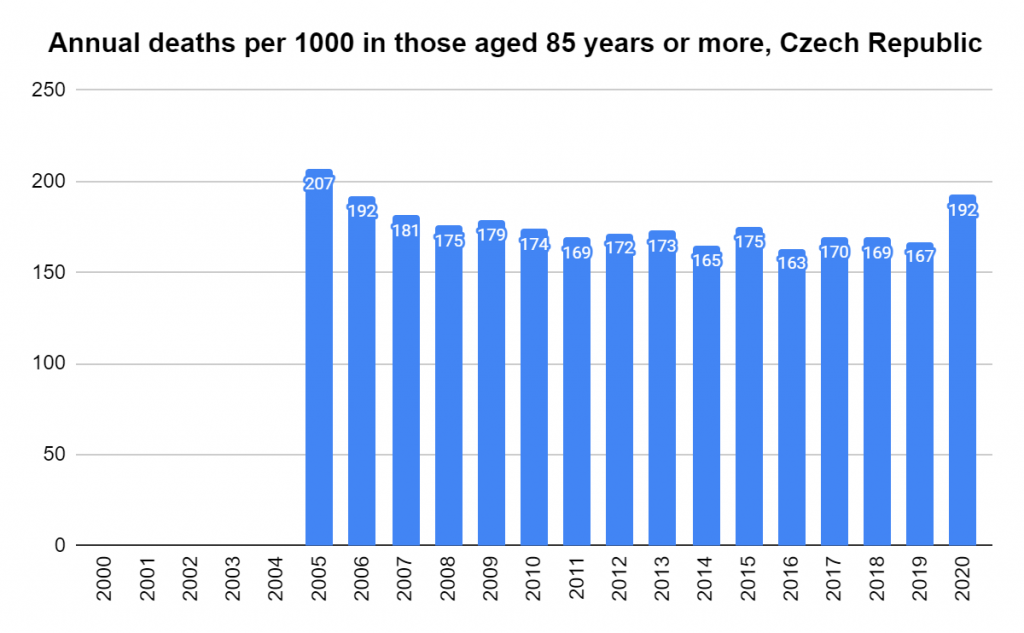
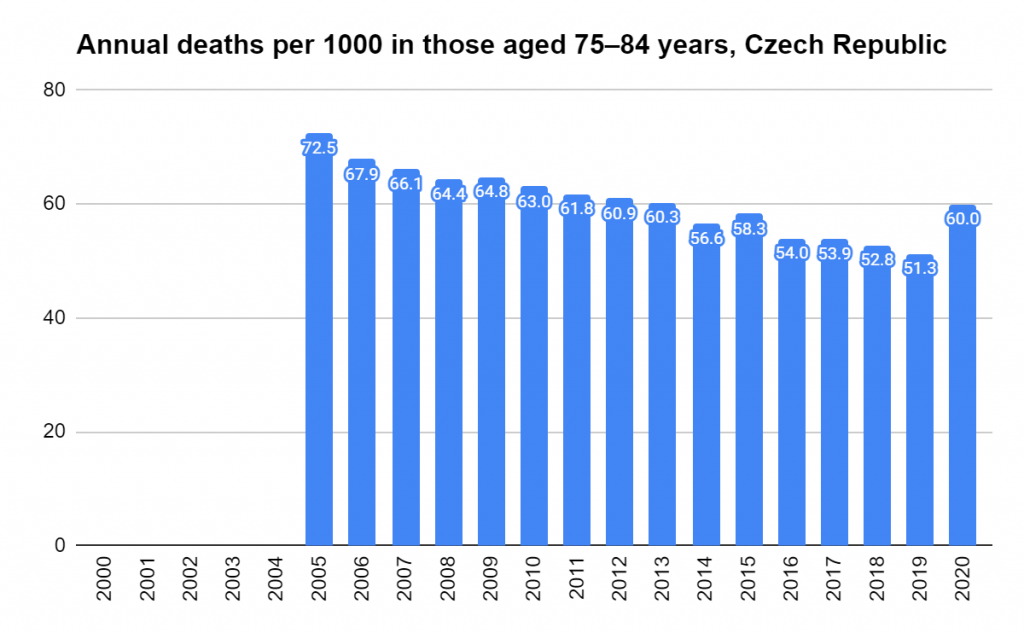
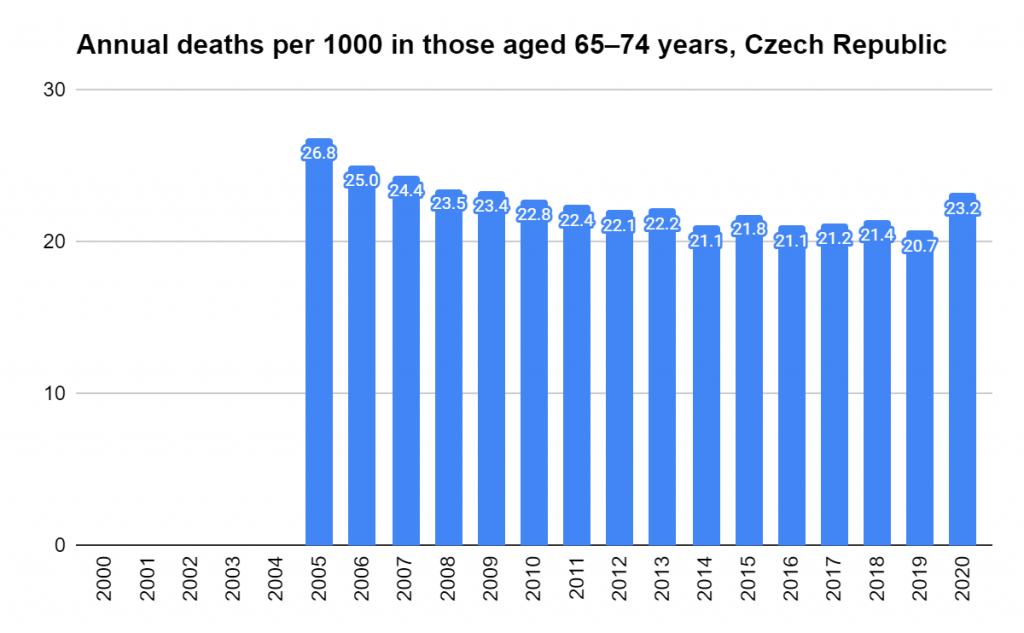
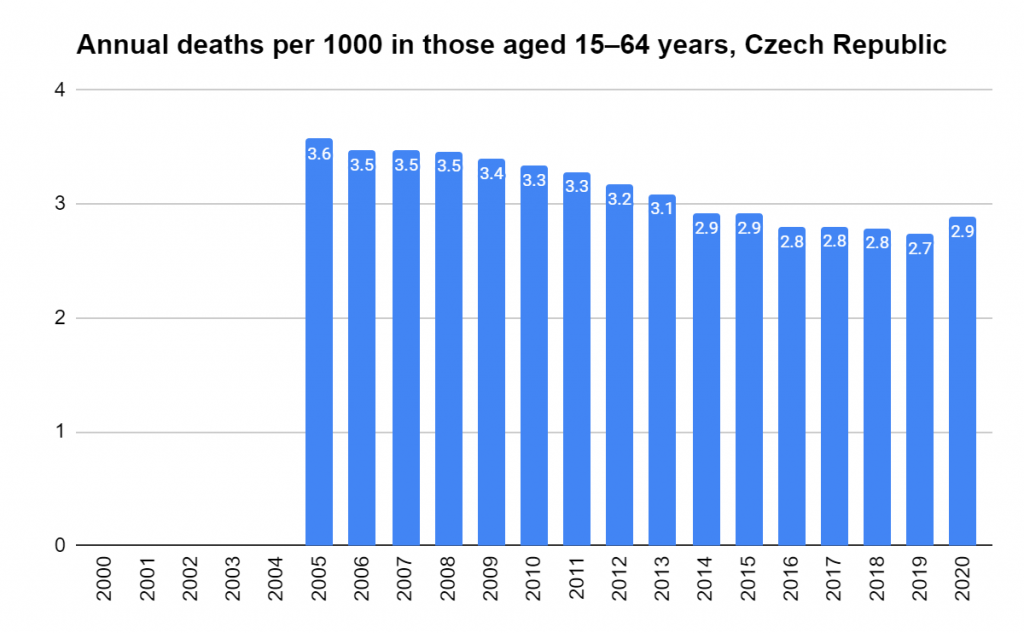
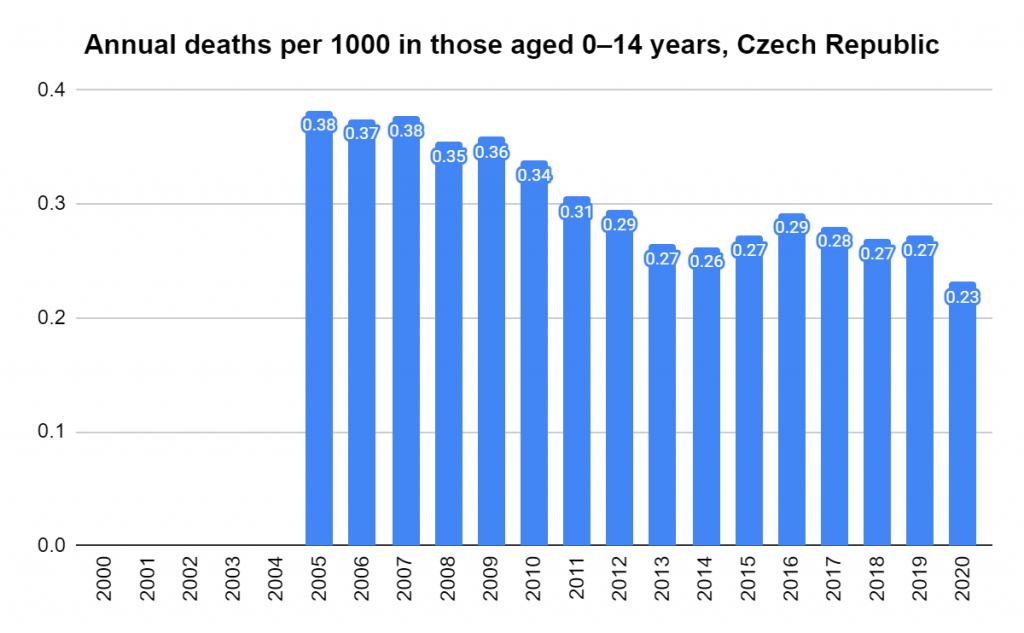
Figure 42. Deaths per 1000 per year in Czech Republic, ages 85 and over. Derived using data from the Human Mortality Database. Calculations and methodsFigure 43. Deaths per 1000 per year in Czech Republic, ages 75-84. Derived using data from the Human Mortality Database. Calculations and methodsFigure 44. Deaths per 1000 per year in Czech Republic, ages 65-74. Derived using data from the Human Mortality Database. Calculations and methodsFigure 45. Deaths per 1000 per year in Czech Republic, ages 15-64. Derived using data from the Human Mortality Database. Calculations and methodsFigure 46. Deaths per 1000 per year in Czech Republic, ages 0-14. Derived using data from the Human Mortality Database. Calculations and methods
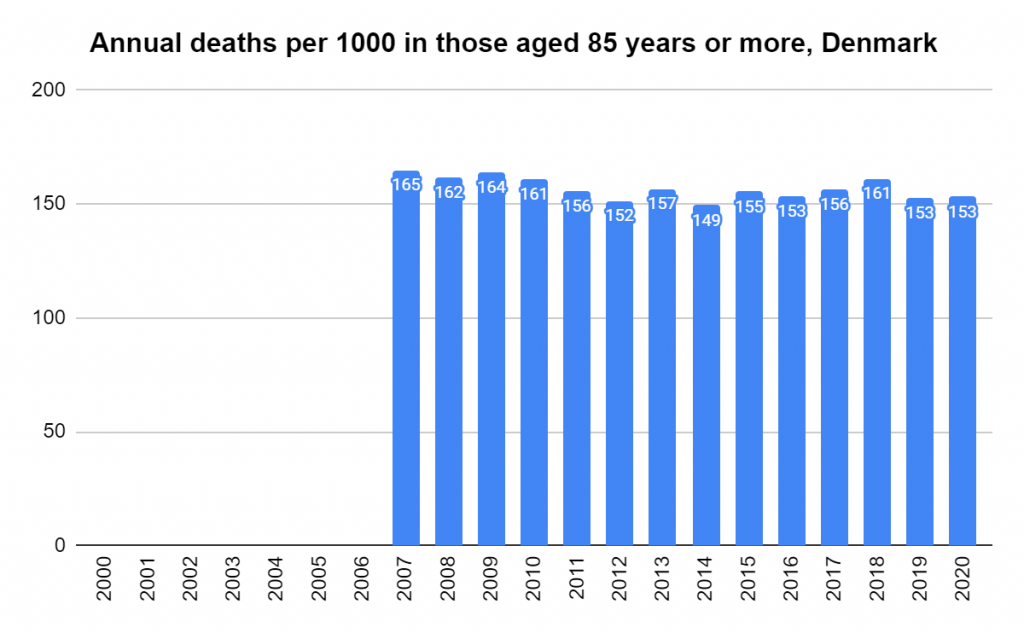
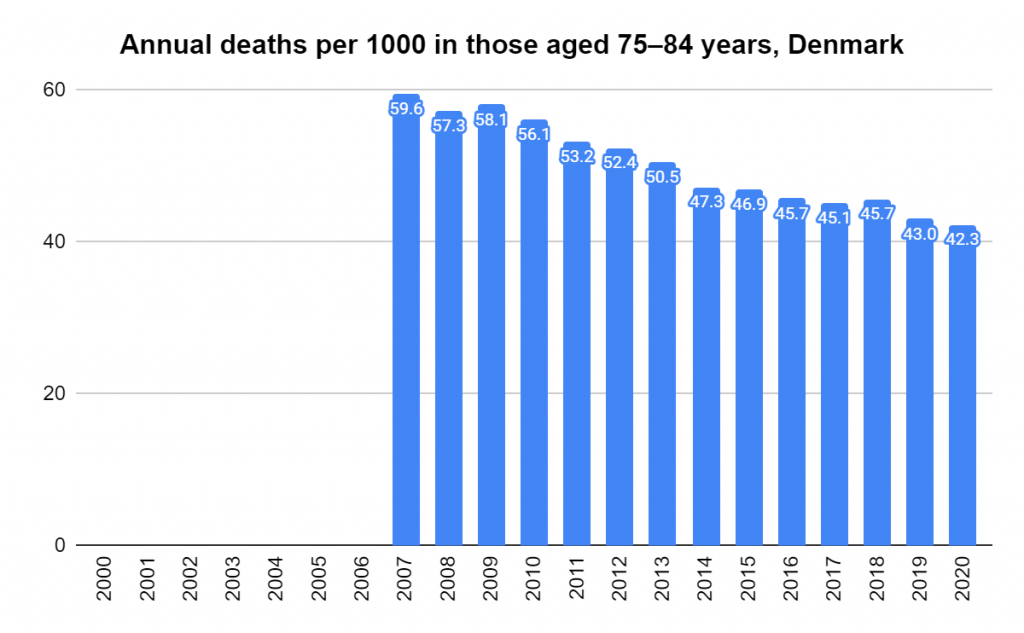
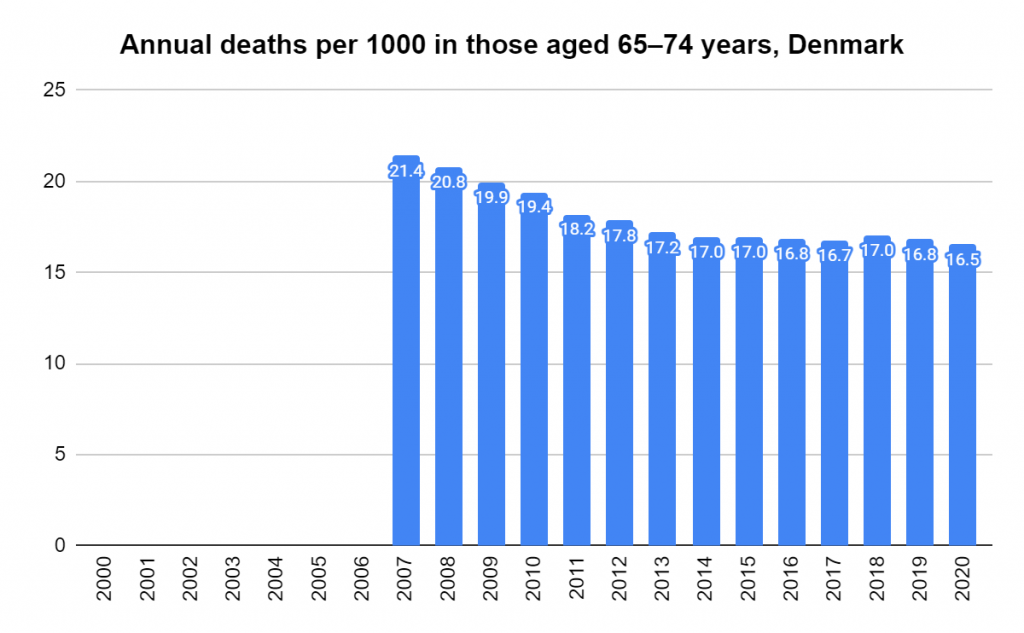
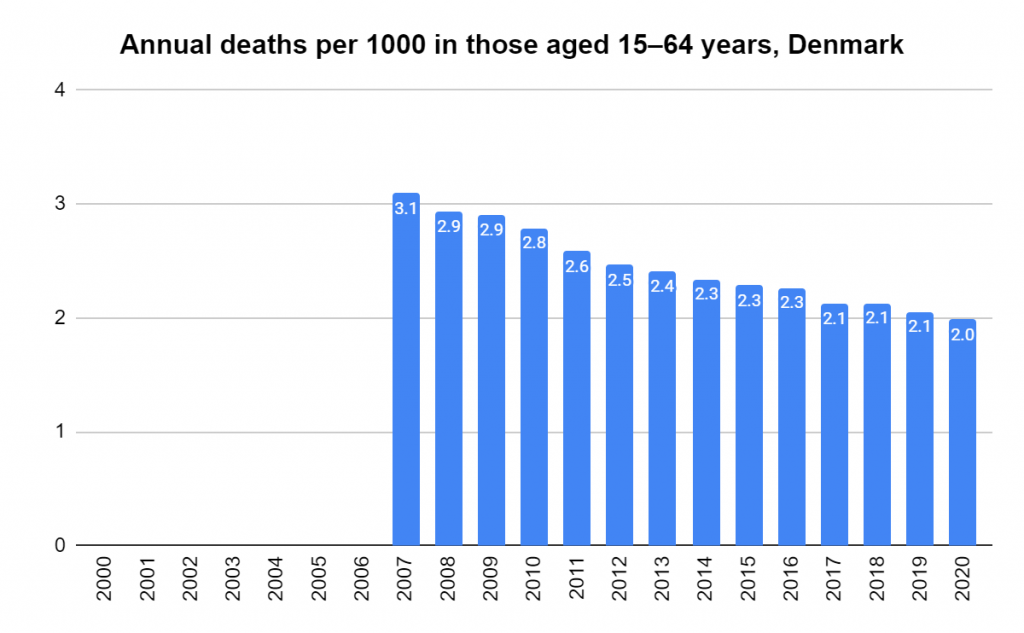
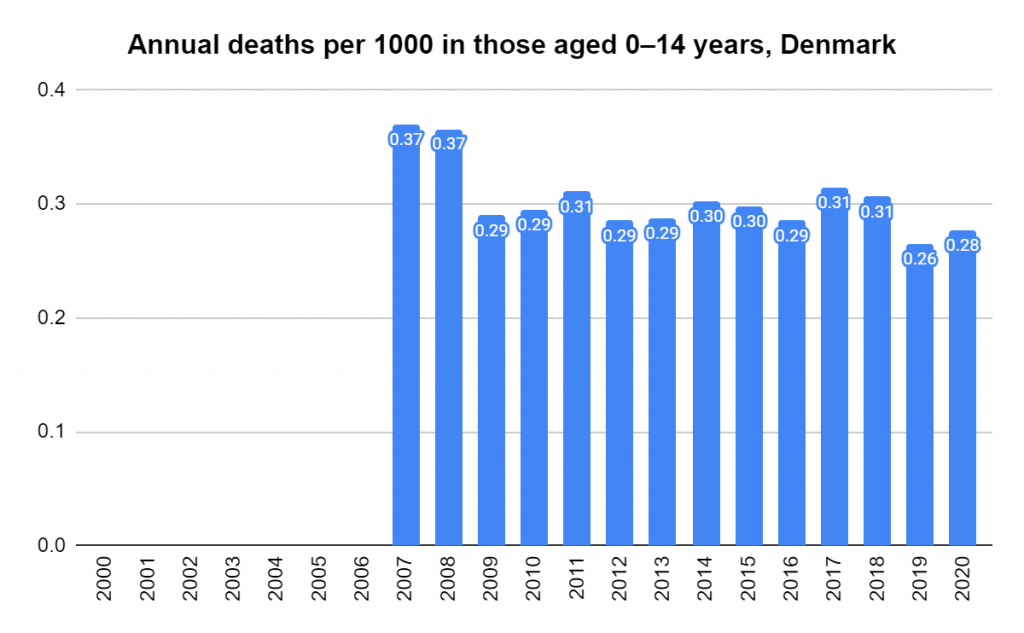
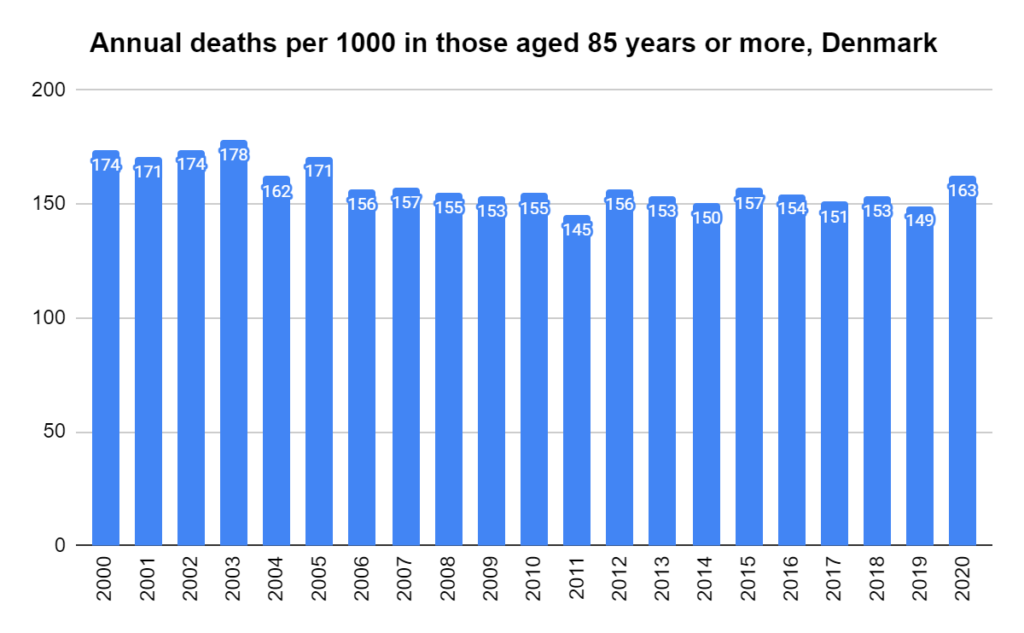
Figure 47. Deaths per 1000 per year in Denmark, ages 85 and over. Derived using data from the Human Mortality Database. Calculations and methodsFigure 48. Deaths per 1000 per year in Denmark, ages 75-84. Derived using data from the Human Mortality Database. Calculations and methodsFigure 49. Deaths per 1000 per year in Denmark, ages 65-74. Derived using data from the Human Mortality Database. Calculations and methodsFigure 50. Deaths per 1000 per year in Denmark, ages 15-64. Derived using data from the Human Mortality Database. Calculations and methodsFigure 51. Deaths per 1000 per year in Denmark, ages 0-14. Derived using data from the Human Mortality Database. Calculations and methods
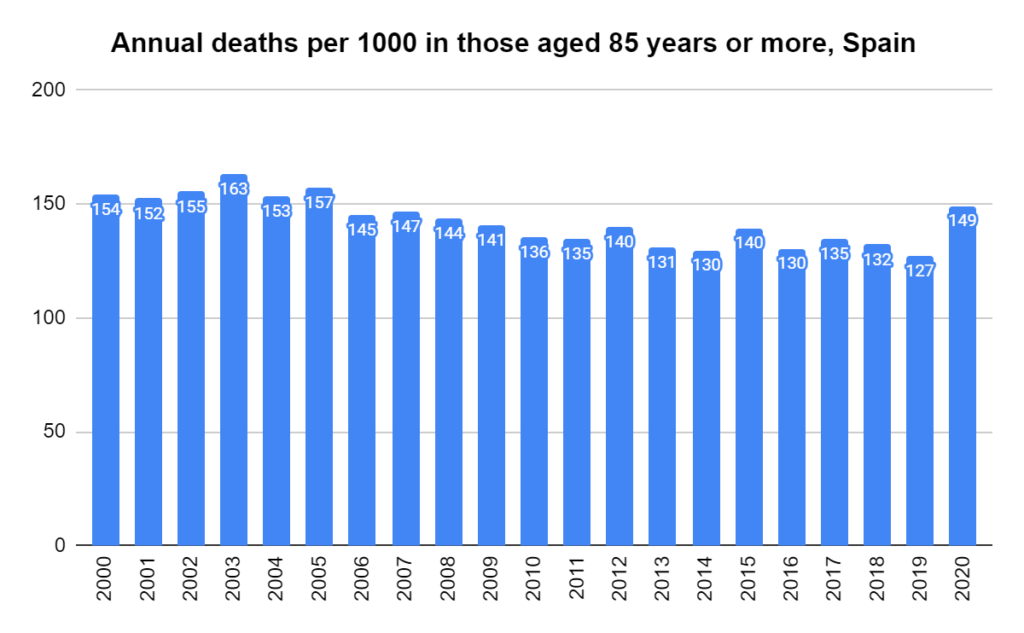
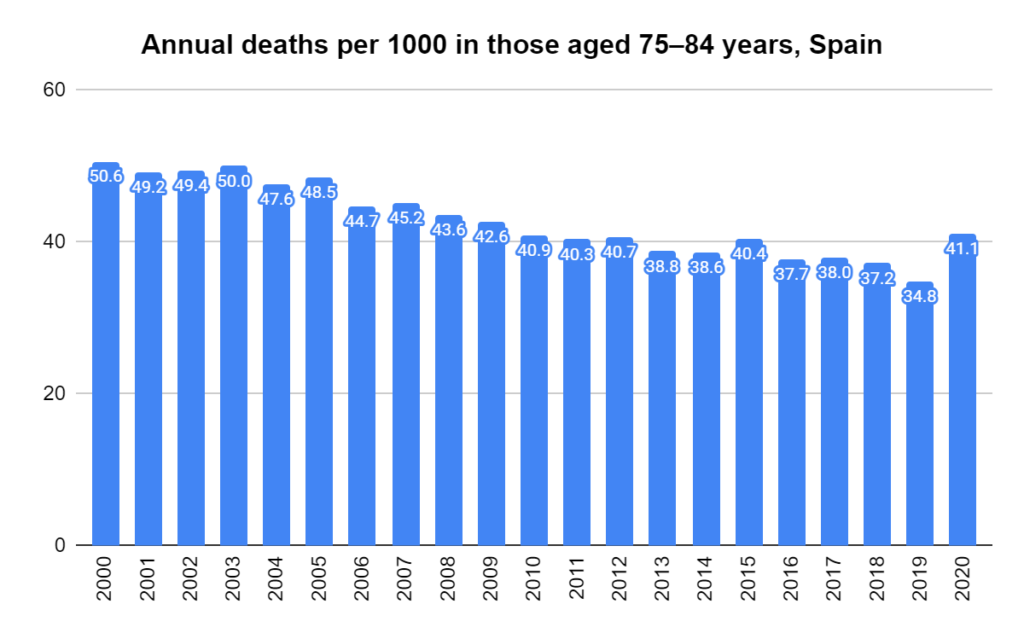
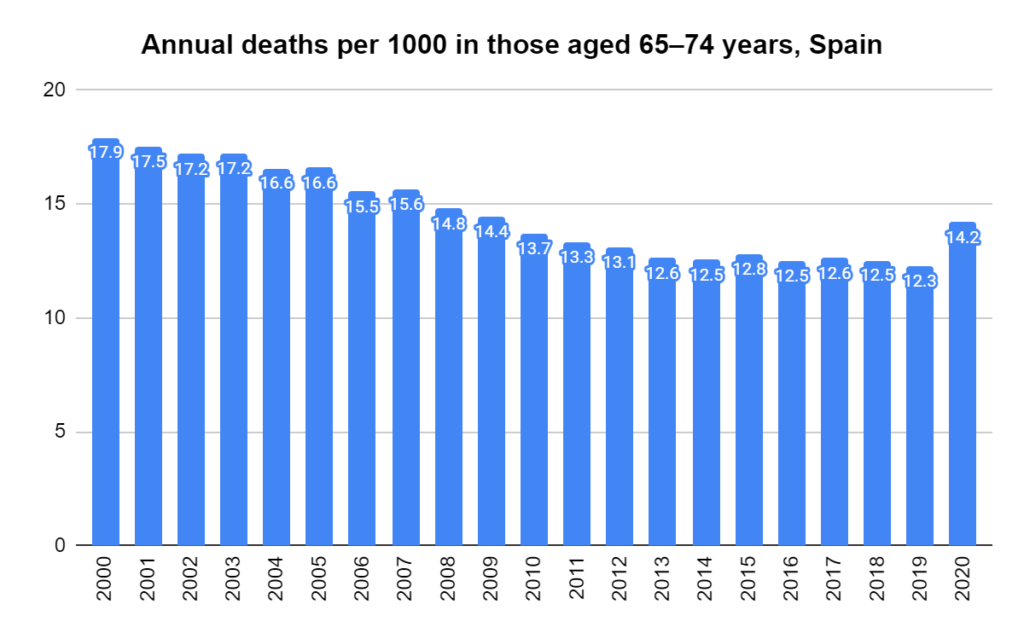
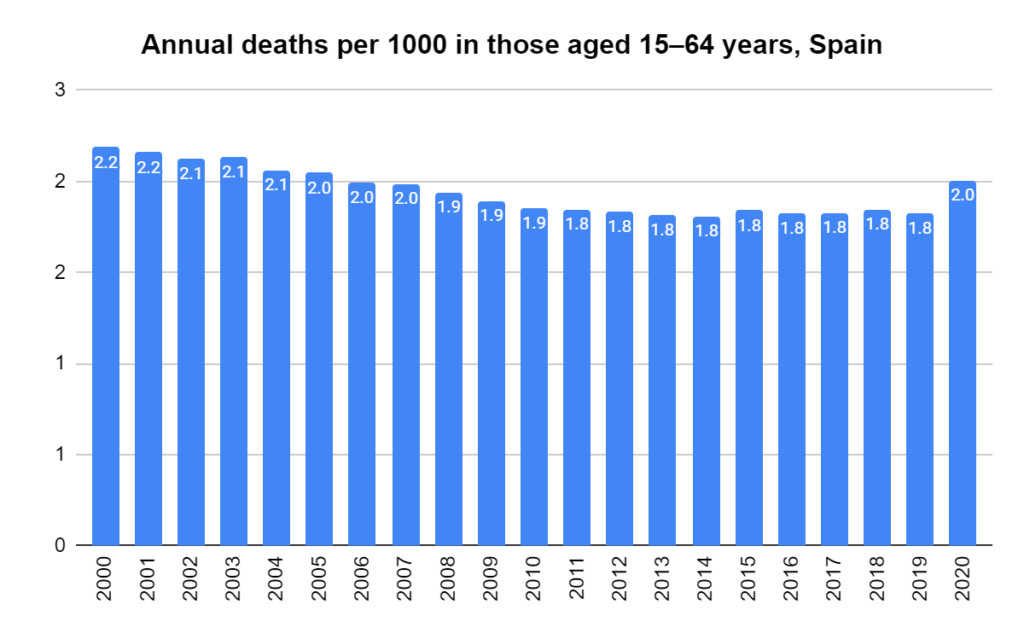
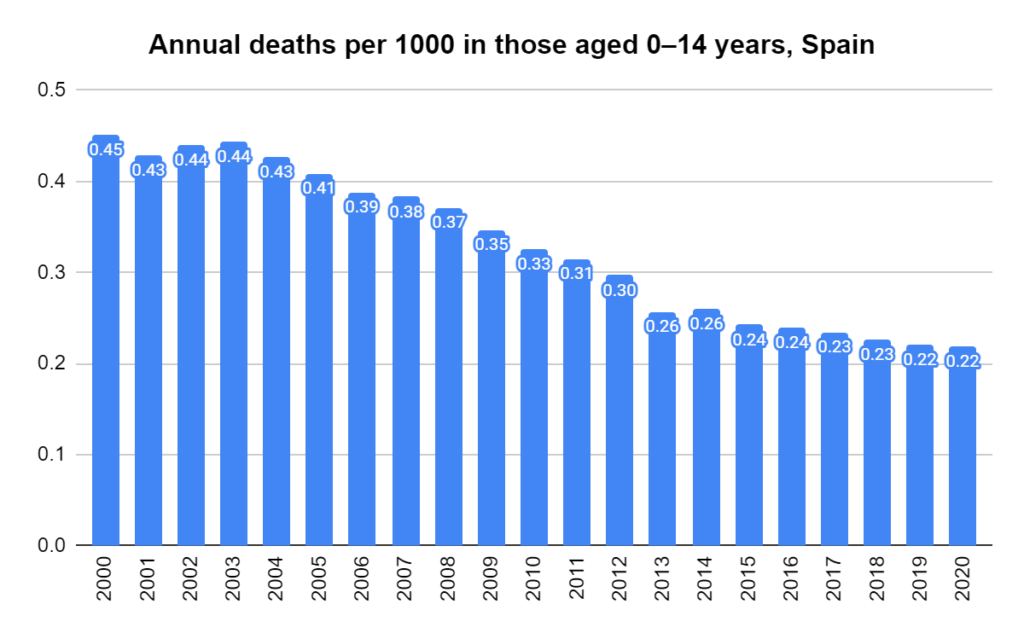
Deaths per 1000 per year in Spain, ages 85 and over. Derived using data from the Human Mortality Database. Calculations and methodsDeaths per 1000 per year in Spain, ages 75-84. Derived using data from the Human Mortality Database. Calculations and methodsDeaths per 1000 per year in Spain, ages 65-74. Derived using data from the Human Mortality Database. Calculations and methodsDeaths per 1000 per year in Spain, ages 15-64. Derived using data from the Human Mortality Database. Calculations and methodsDeaths per 1000 per year in Spain, ages 0-14. Derived using data from the Human Mortality Database. Calculations and methods
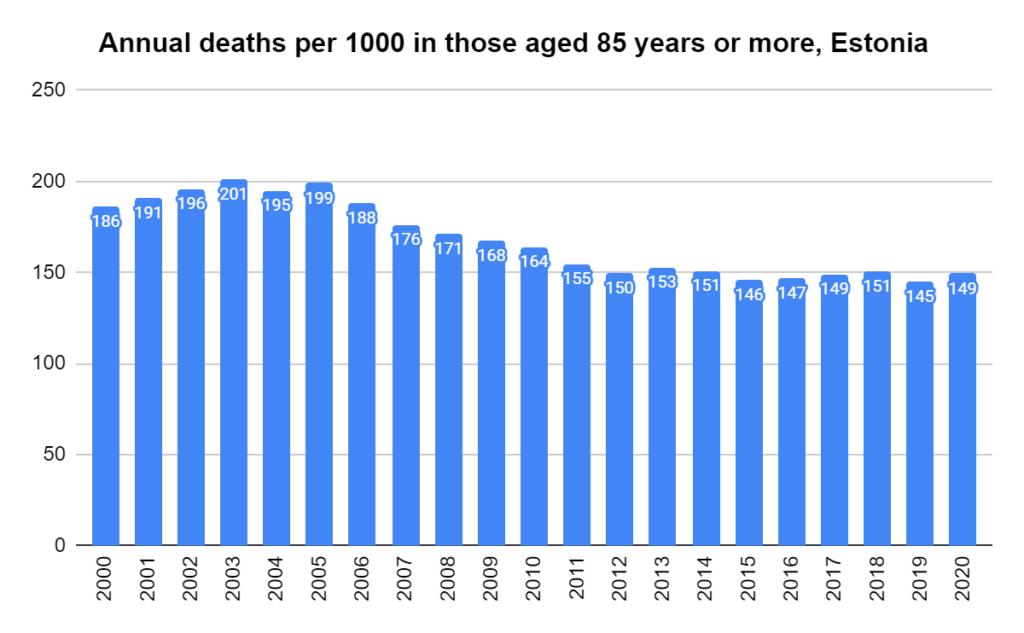
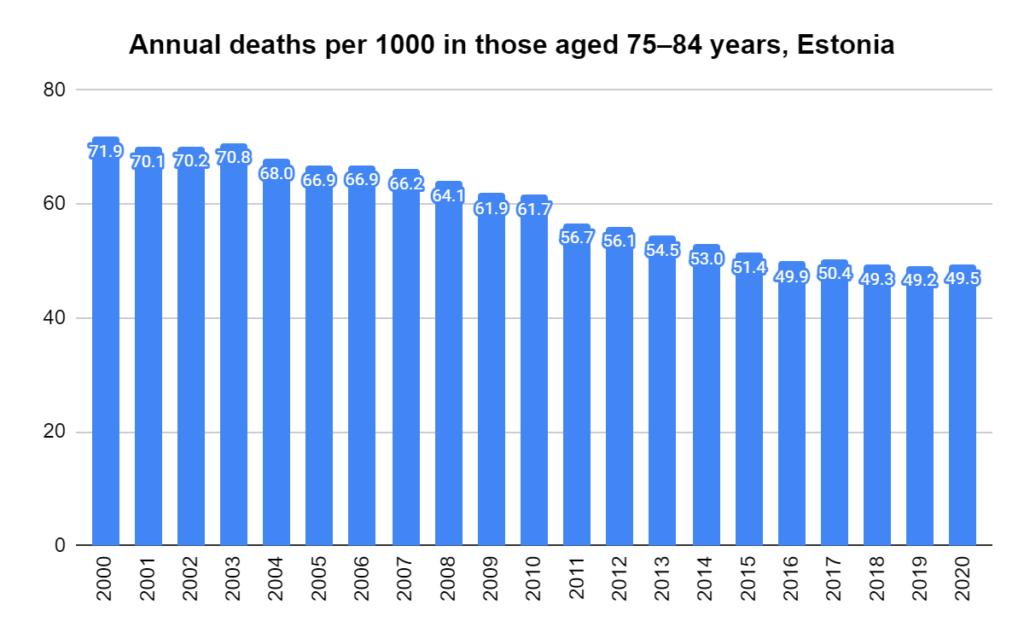
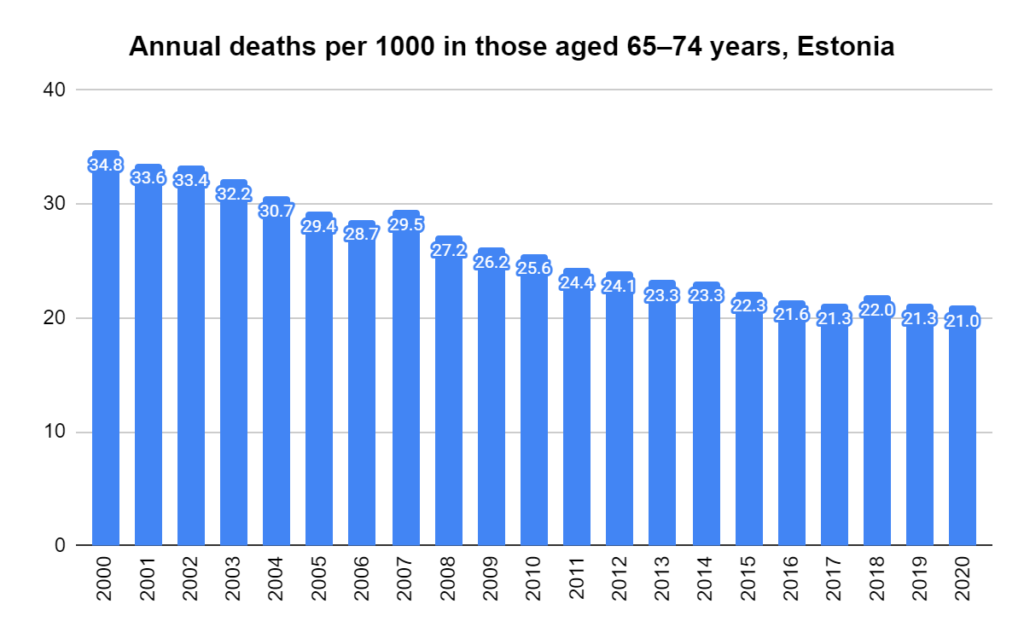
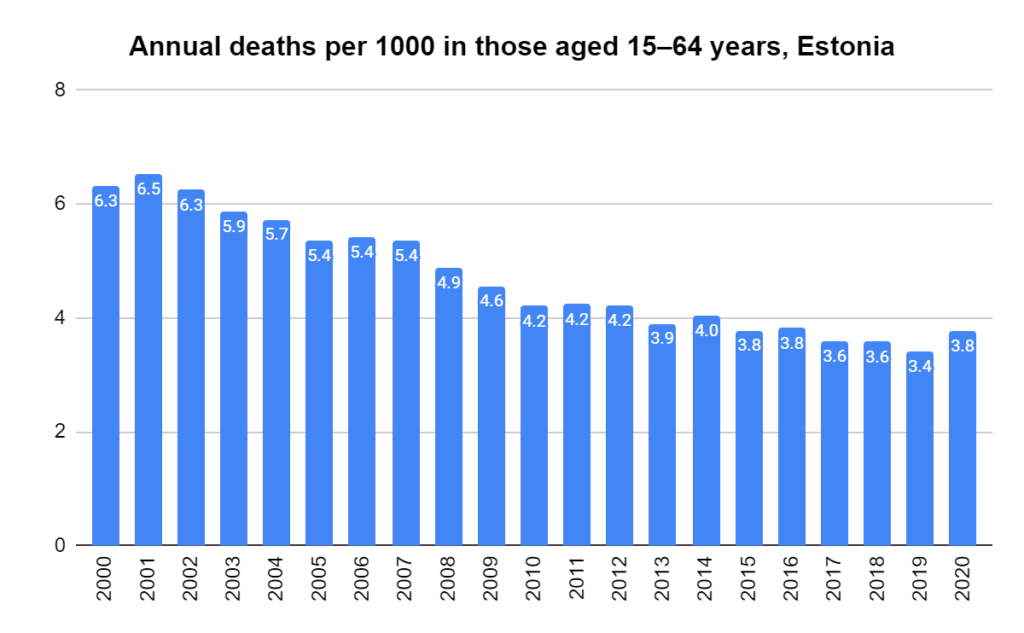
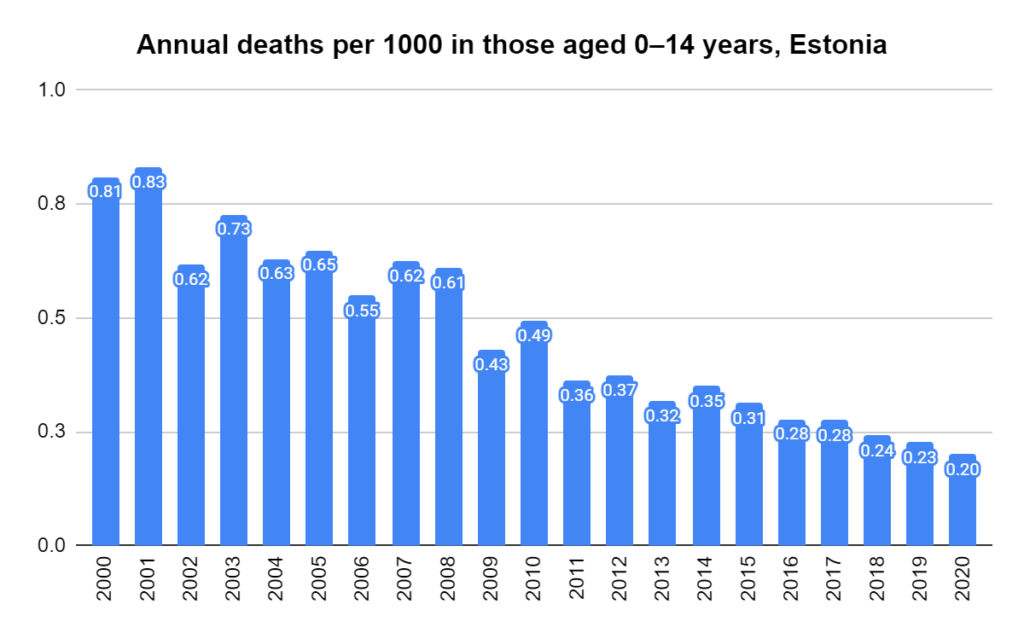
Deaths per 1000 per year in Estonia, ages 85 and over. Derived using data from the Human Mortality Database. Calculations and methodsDeaths per 1000 per year in Estonia, ages 75-84. Derived using data from the Human Mortality Database. Calculations and methodsDeaths per 1000 per year in Estonia, ages 65-74. Derived using data from the Human Mortality Database. Calculations and methodsDeaths per 1000 per year in Estonia, ages 15-64. Derived using data from the Human Mortality Database. Calculations and methodsDeaths per 1000 per year in Estonia, ages 0-14. Derived using data from the Human Mortality Database. Calculations and methods
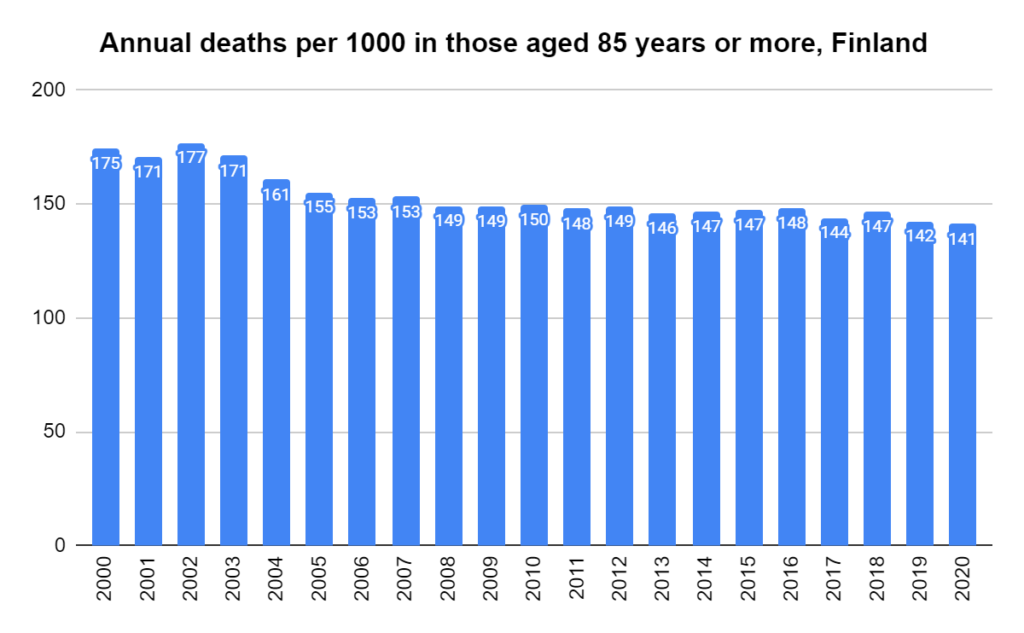
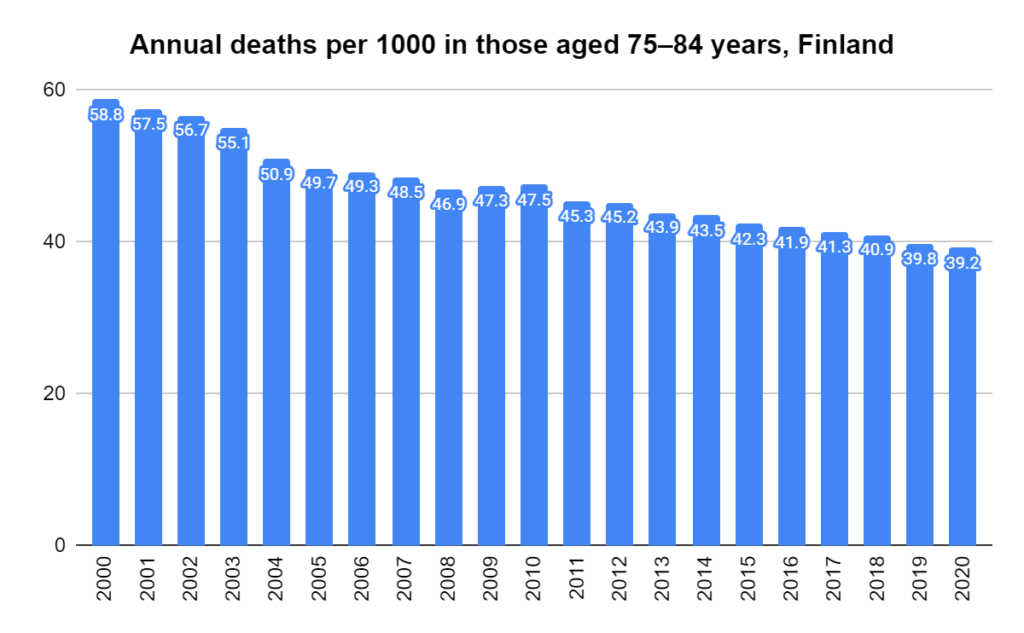
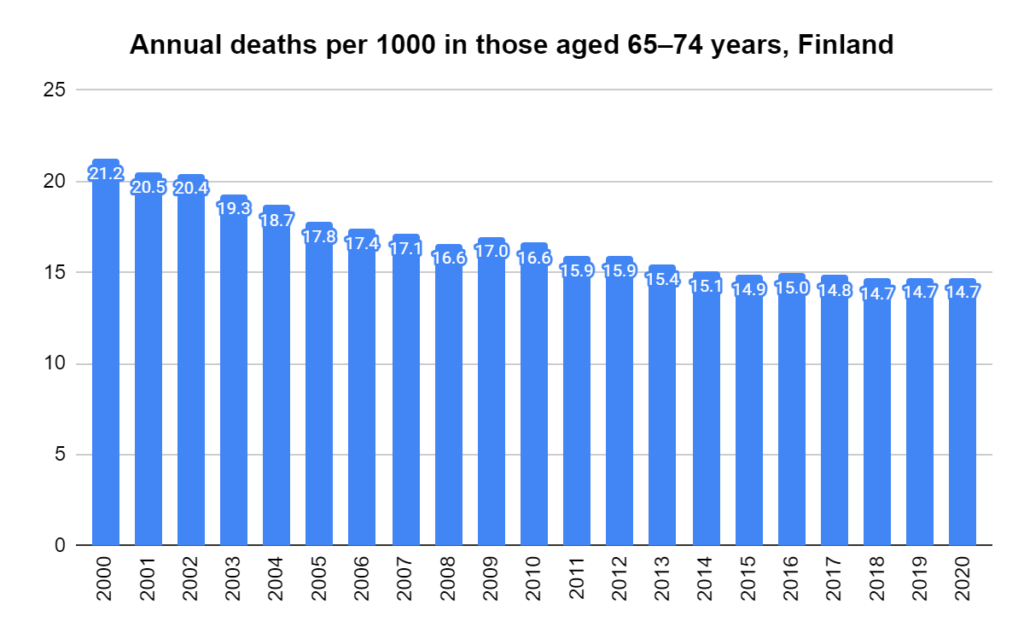
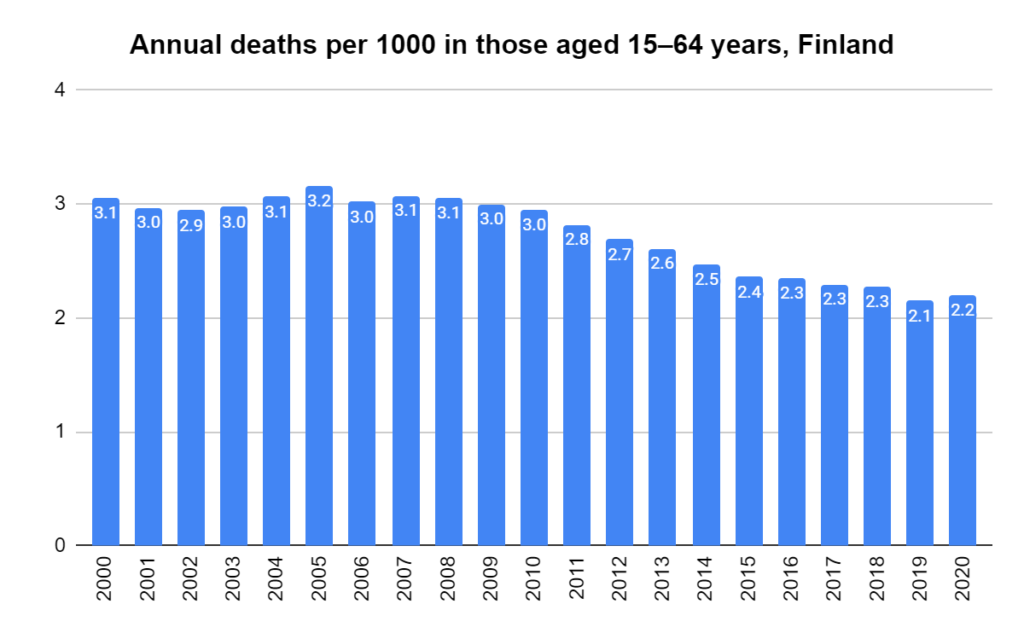
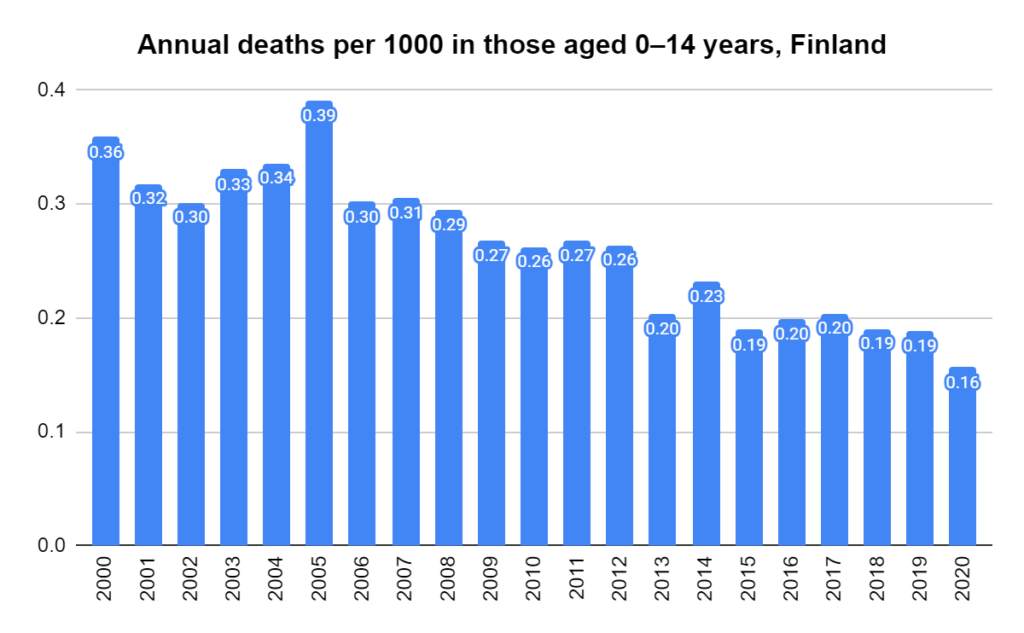
Deaths per 1000 per year in Finland, ages 85 years and over. Derived using data from the Human Mortality Database. Calculations and methodsDeaths per 1000 per year in Finland, ages 75-84. Derived using data from the Human Mortality Database. Calculations and methodsDeaths per 1000 per year in Finland, ages 65-74. Derived using data from the Human Mortality Database. Calculations and methodsDeaths per 1000 per year in Finland, ages 15-64. Derived using data from the Human Mortality Database. Calculations and methodsDeaths per 1000 per year in Finland, ages 0-14. Derived using data from the Human Mortality Database. Calculations and methods
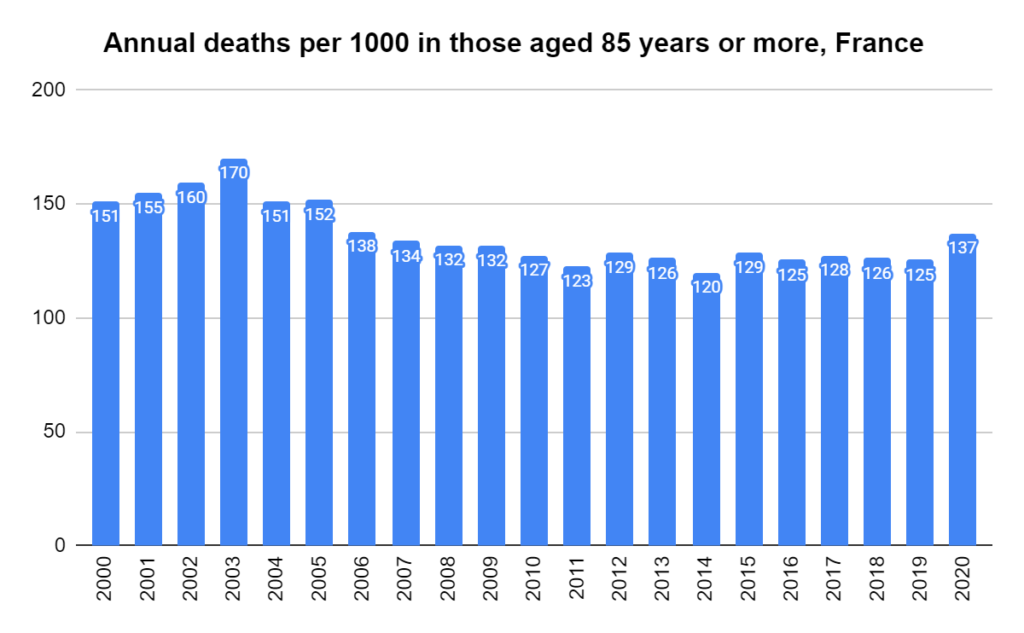
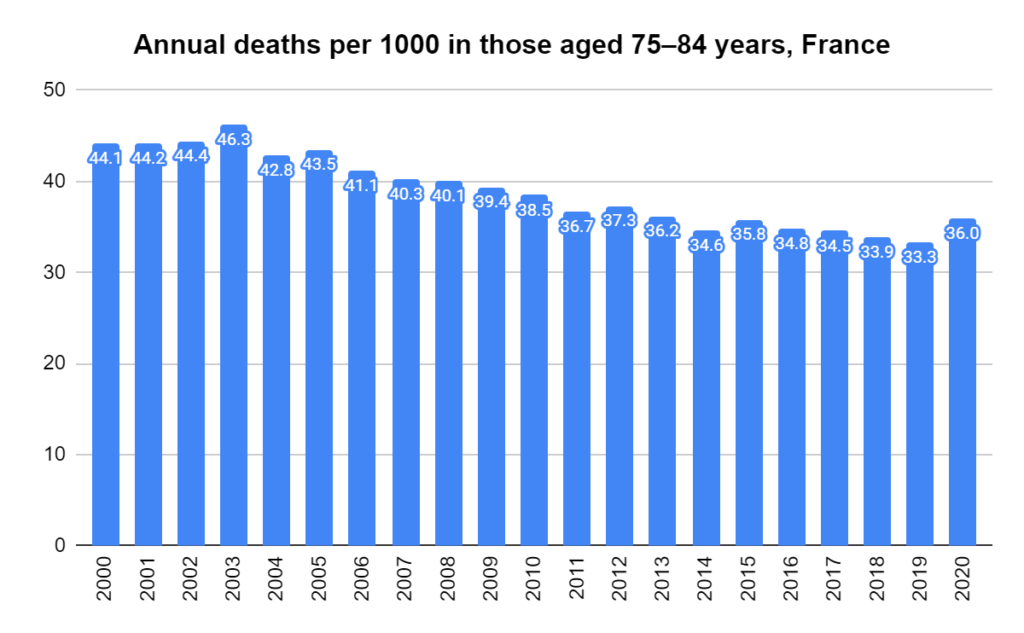
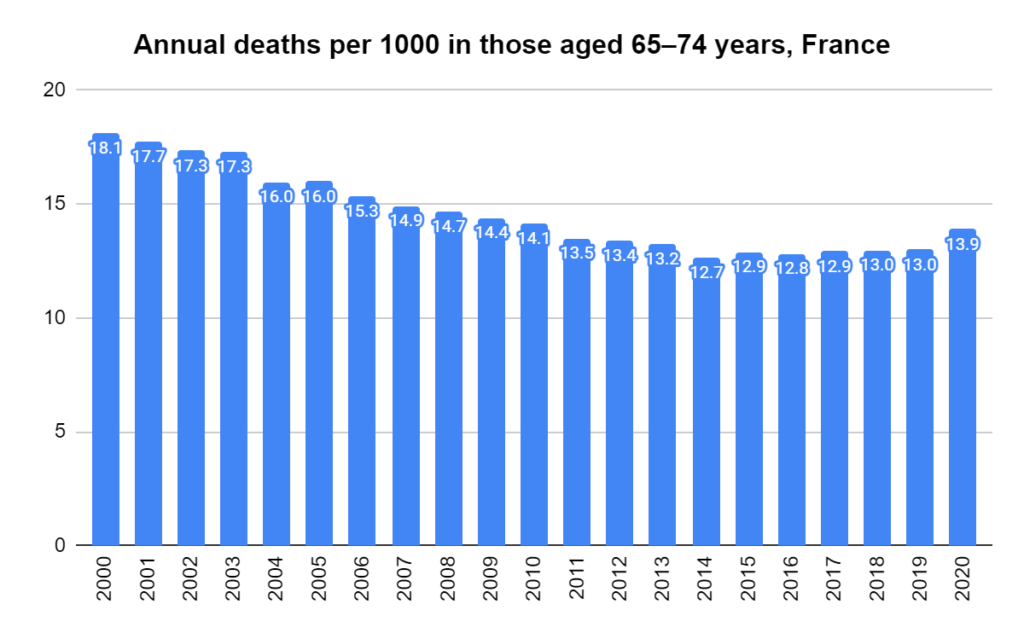
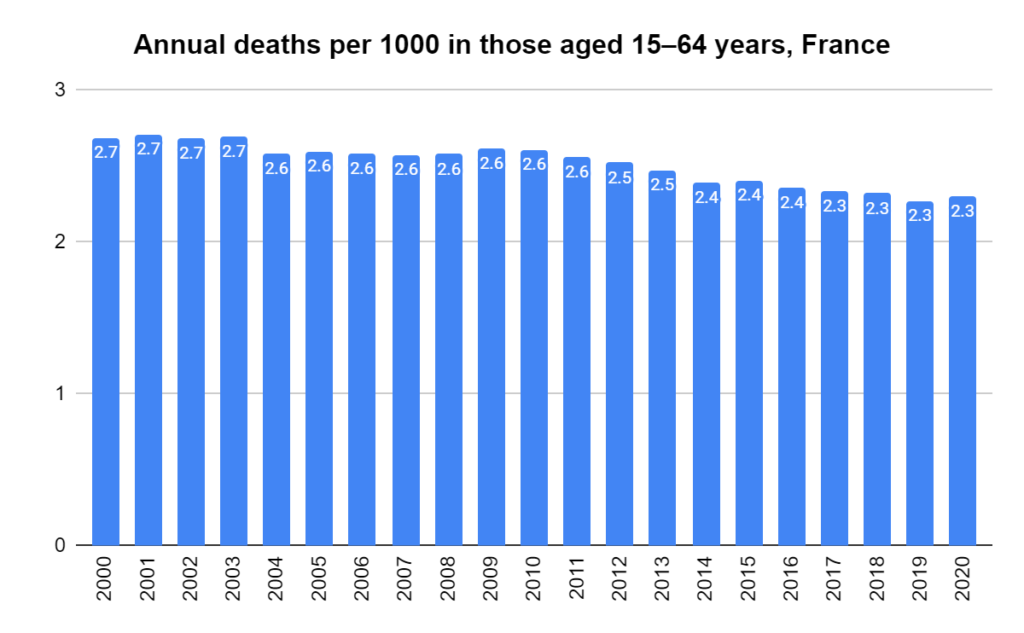
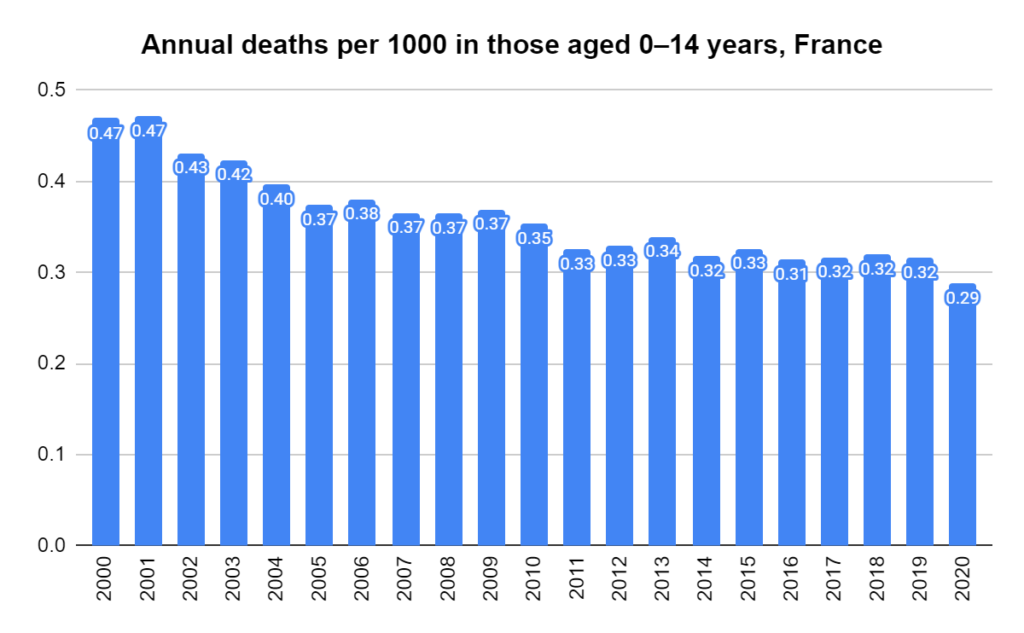
Deaths per 1000 per year in France, ages 85 years and over. Derived using data from the Human Mortality Database. Calculations and methodsDeaths per 1000 per year in France, ages 75-84. Derived using data from the Human Mortality Database. Calculations and methodsDeaths per 1000 per year in France, ages 65-74. Derived using data from the Human Mortality Database. Calculations and methodsDeaths per 1000 per year in France, ages 15-64. Derived using data from the Human Mortality Database. Calculations and methodsDeaths per 1000 per year in France, ages 0-14. Derived using data from the Human Mortality Database. Calculations and methods
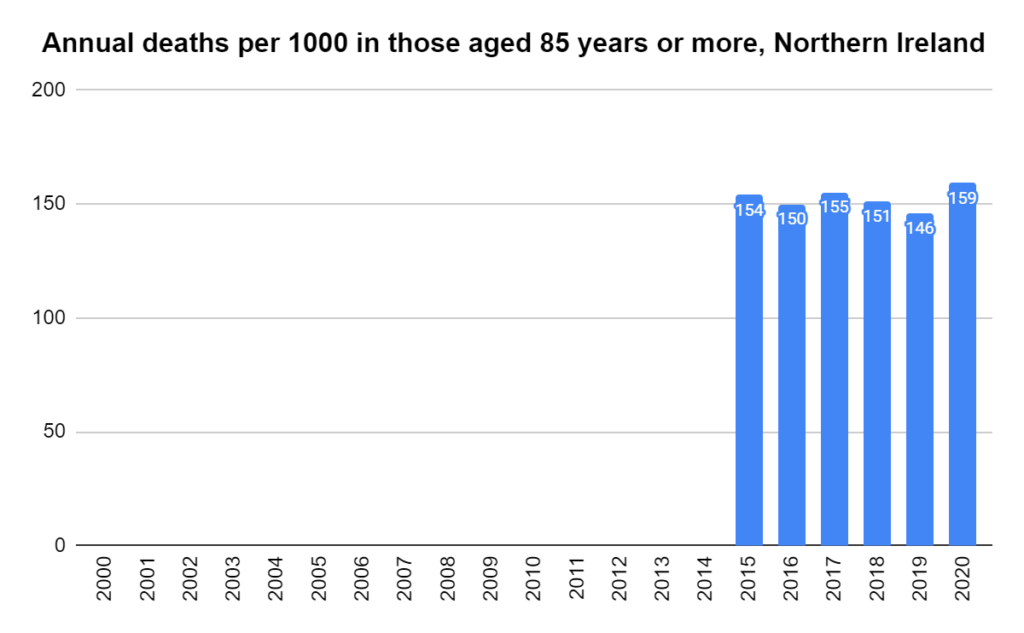
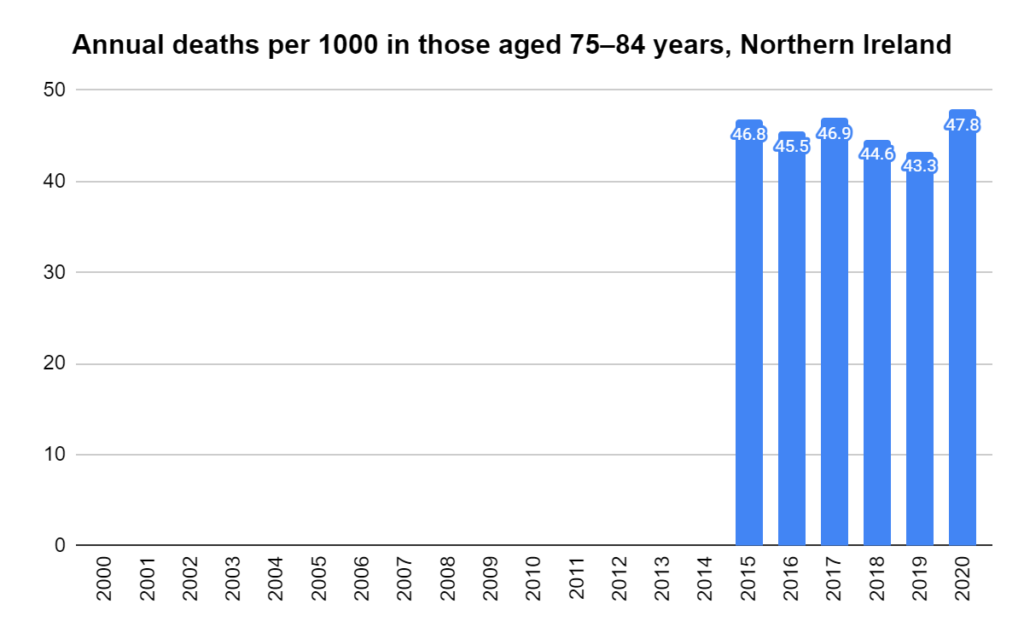
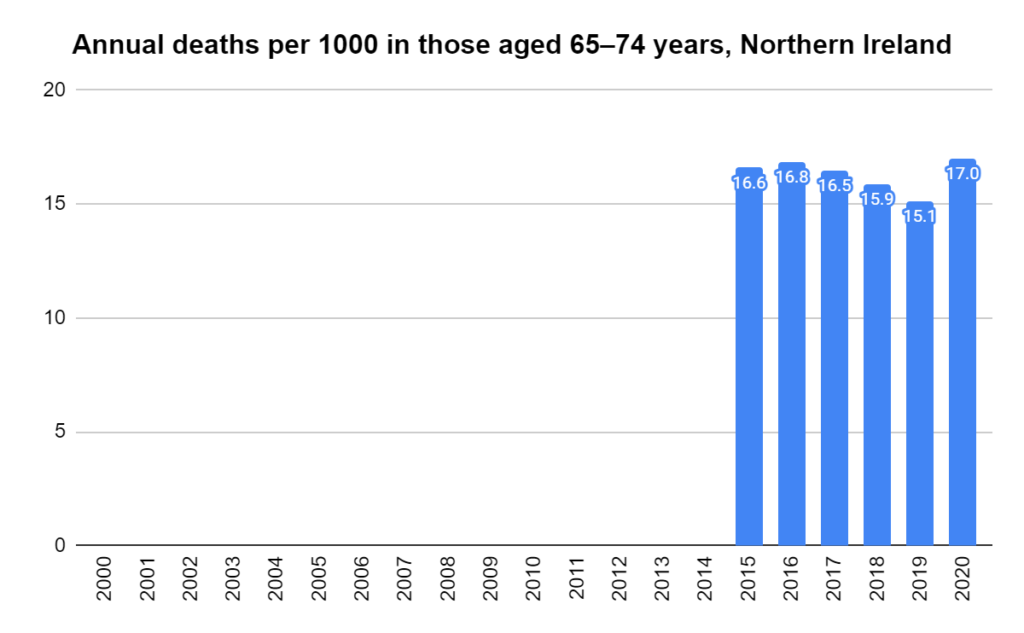
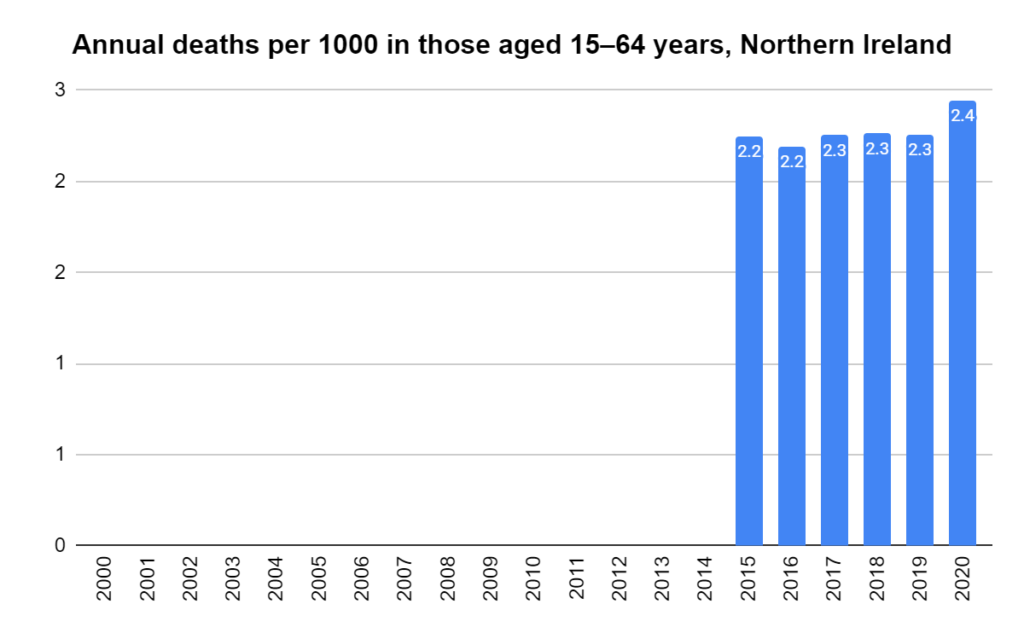
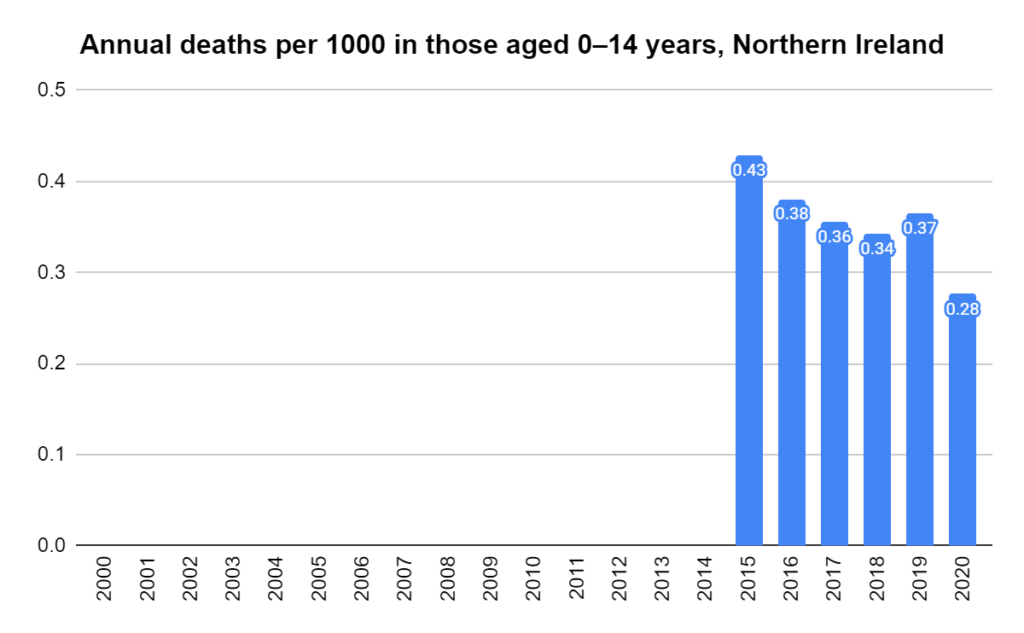
Deaths per 1000 per year in Northern Ireland, ages 85 and over. Derived using data from the Human Mortality Database. Calculations and methodsDeaths per 1000 per year in Northern Ireland, ages 75-84. Derived using data from the Human Mortality Database. Calculations and methodsDeaths per 1000 per year in Northern Ireland, ages 65-74. Derived using data from the Human Mortality Database. Calculations and methodsDeaths per 1000 per year in Northern Ireland, ages 15-64. Derived using data from the Human Mortality Database. Calculations and methodsDeaths per 1000 per year in Northern Ireland, ages 0-14. Derived using data from the Human Mortality Database. Calculations and methods
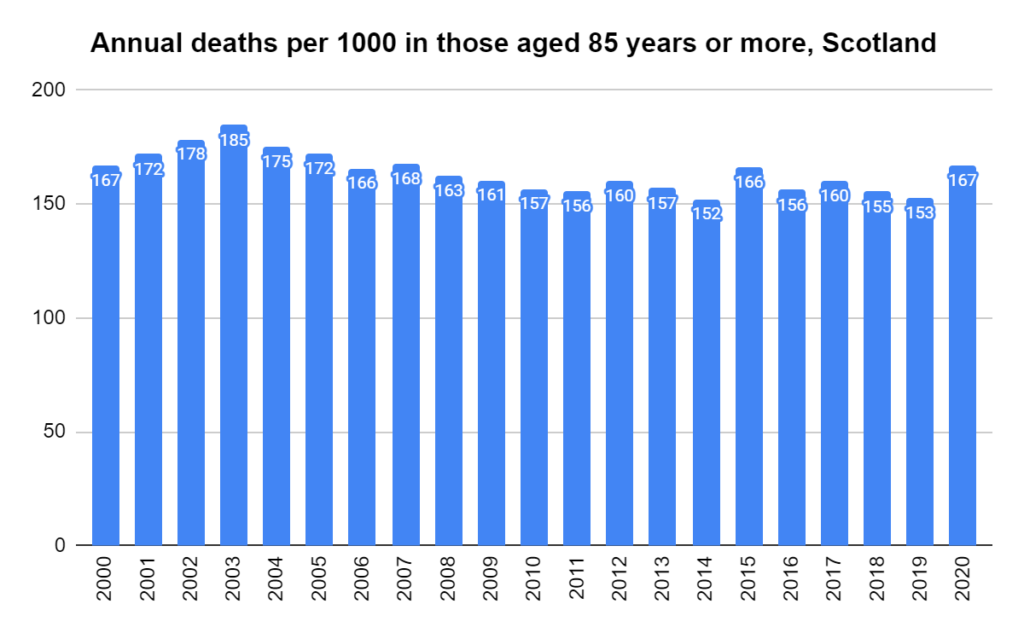
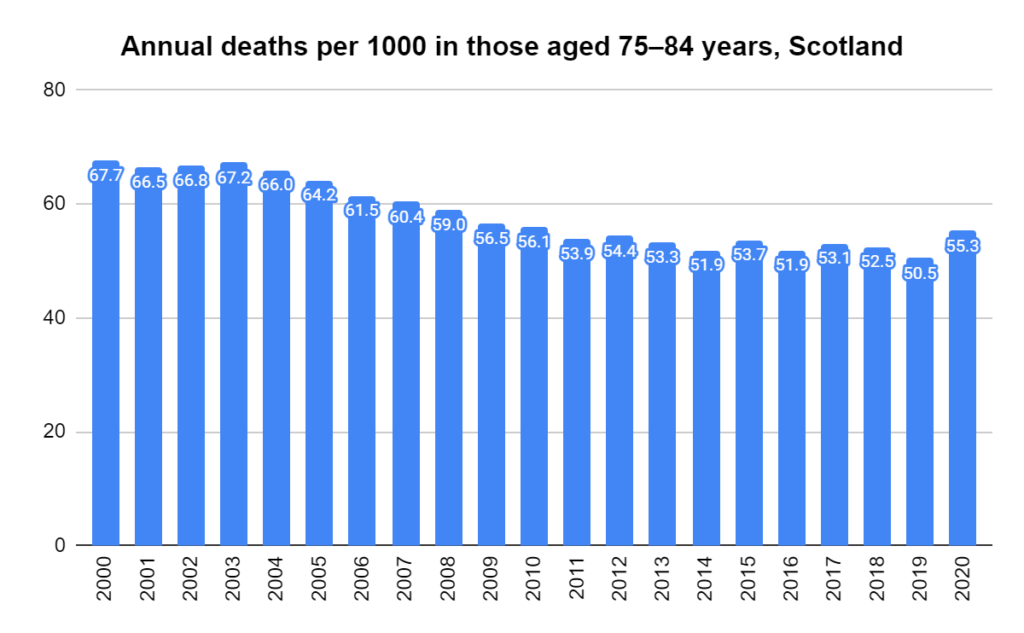
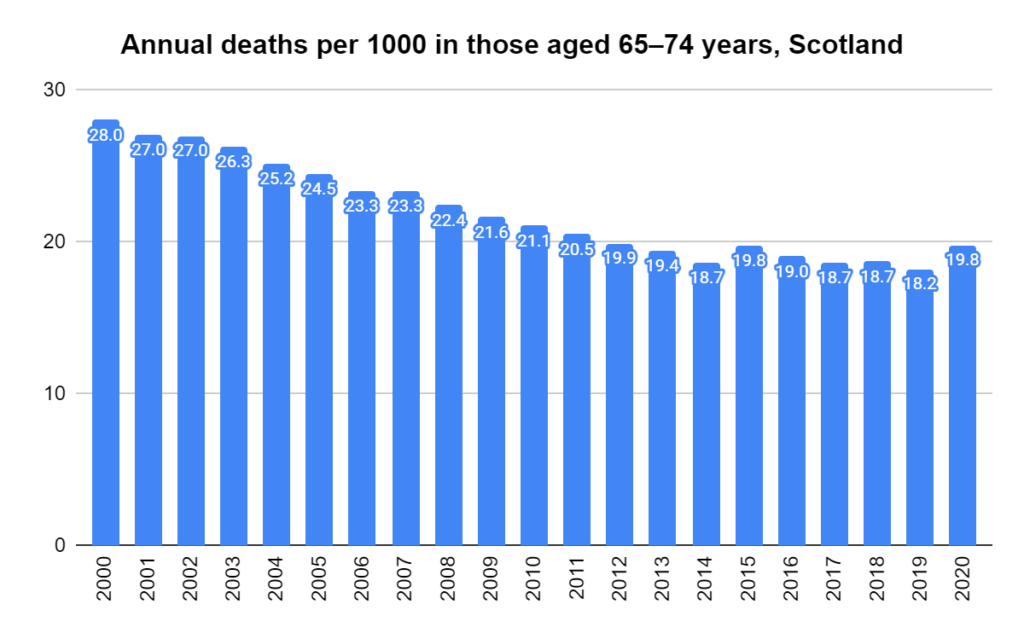
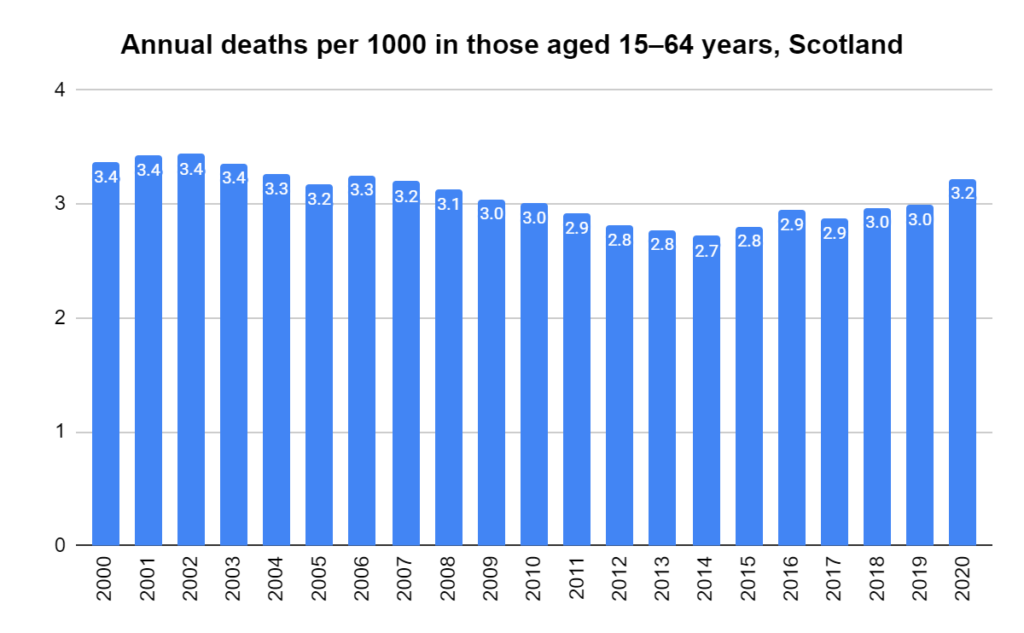
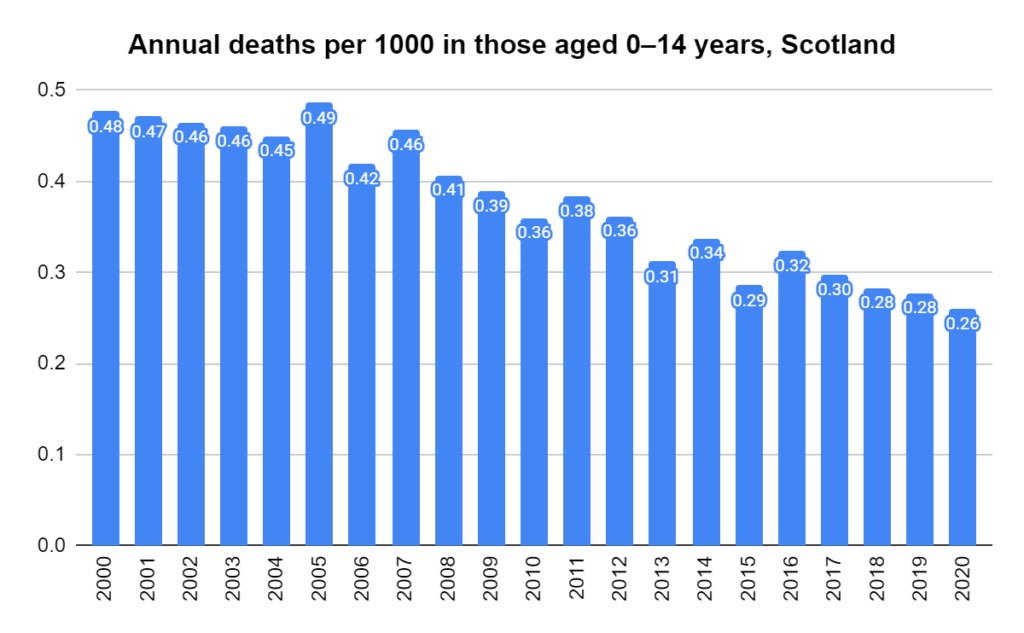
Deaths per 1000 per year in Scotland, ages 85 years and over. Derived using data from the Human Mortality Database. Calculations and methodsDeaths per 1000 per year in Scotland, ages 75-84. Derived using data from the Human Mortality Database. Calculations and methodsDeaths per 1000 per year in Scotland, ages 65-74. Derived using data from the Human Mortality Database. Calculations and methodsDeaths per 1000 per year in Scotland, ages 15-64. Derived using data from the Human Mortality Database. Calculations and methodsDeaths per 1000 per year in Scotland, ages 0-14. Derived using data from the Human Mortality Database. Calculations and methods
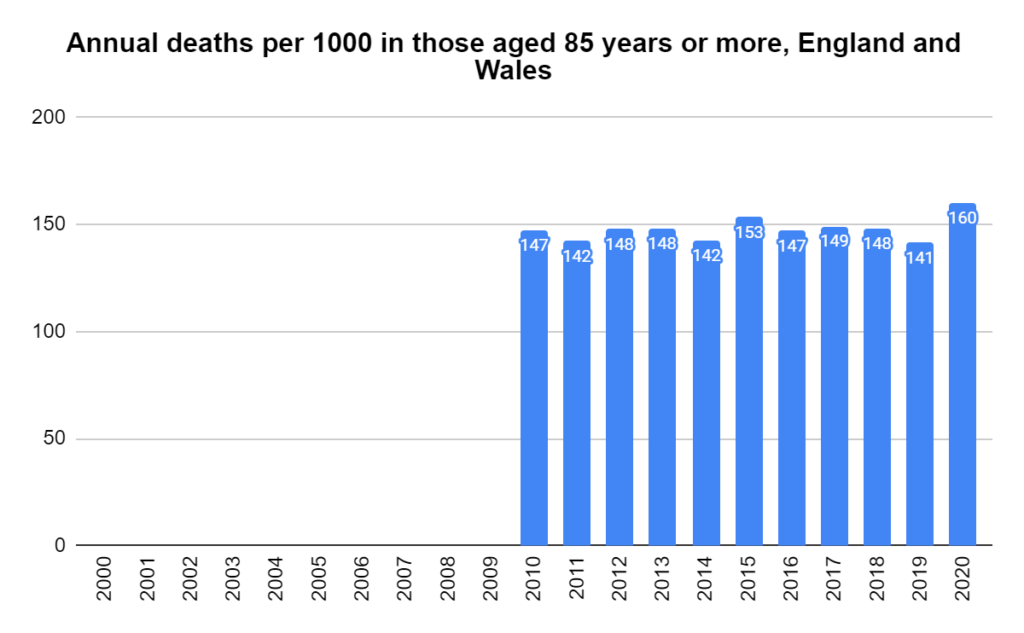
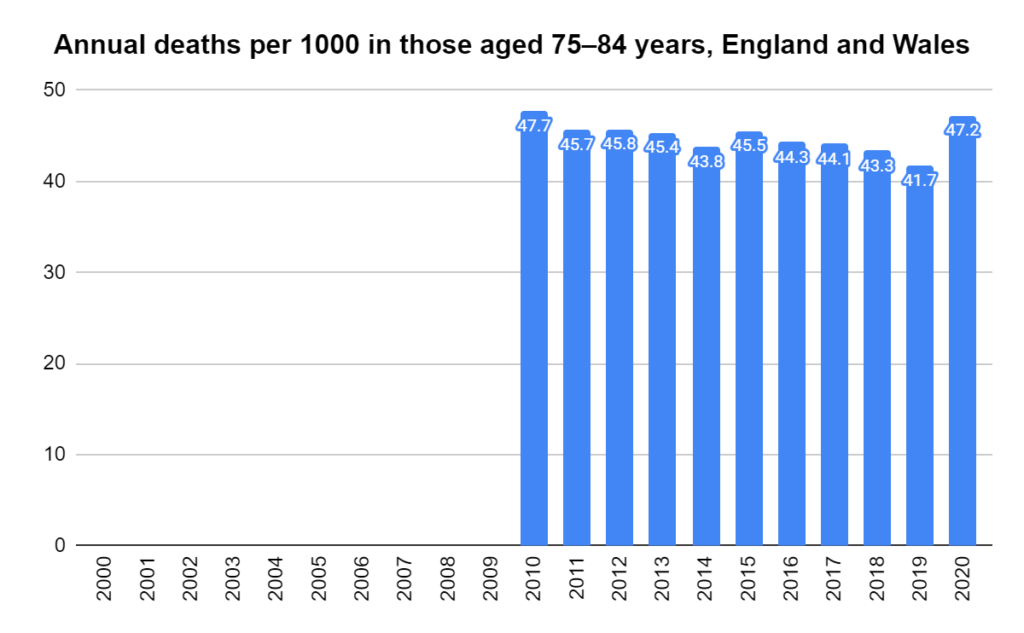
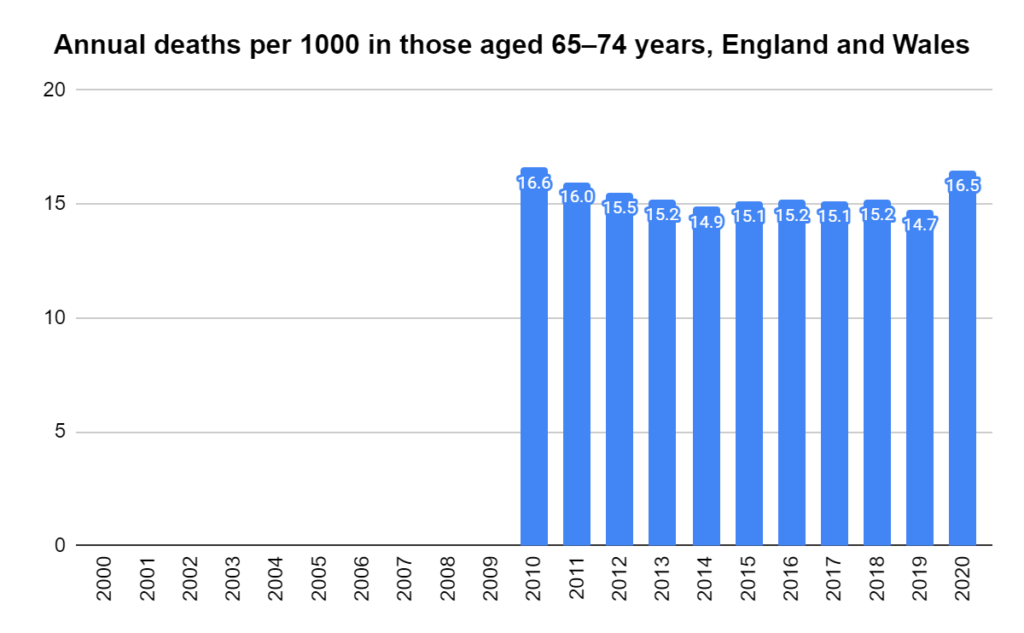
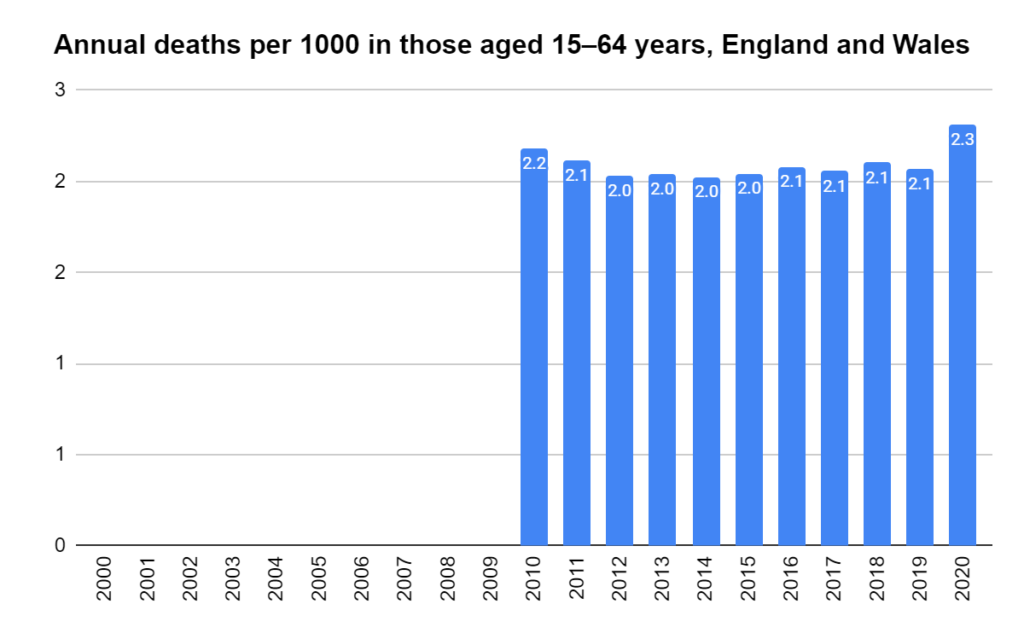
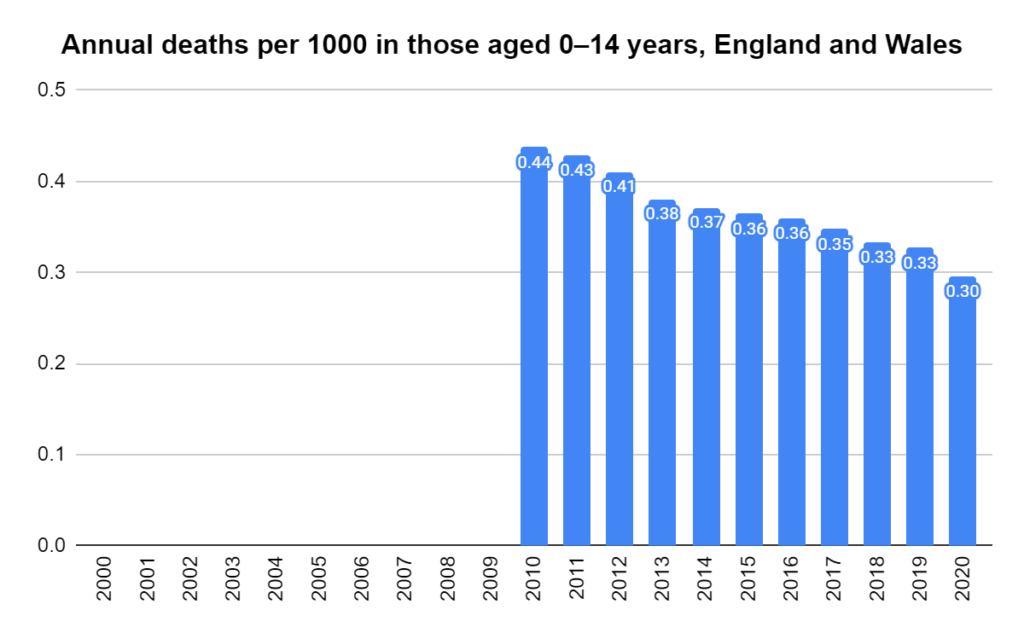
Deaths per 1000 per year in England and Wales, ages 85 years and over. Derived using data from the Human Mortality Database. Calculations and methodsDeaths per 1000 per year in England and Wales, ages 75-84. Derived using data from the Human Mortality Database. Calculations and methodsDeaths per 1000 per year in England and Wales, ages 65-74. Derived using data from the Human Mortality Database. Calculations and methodsDeaths per 1000 per year in England and Wales, ages 15-64. Derived using data from the Human Mortality Database. Calculations and methodsDeaths per 1000 per year in England and Wales, ages 0-14. Derived using data from the Human Mortality Database. Calculations and methods
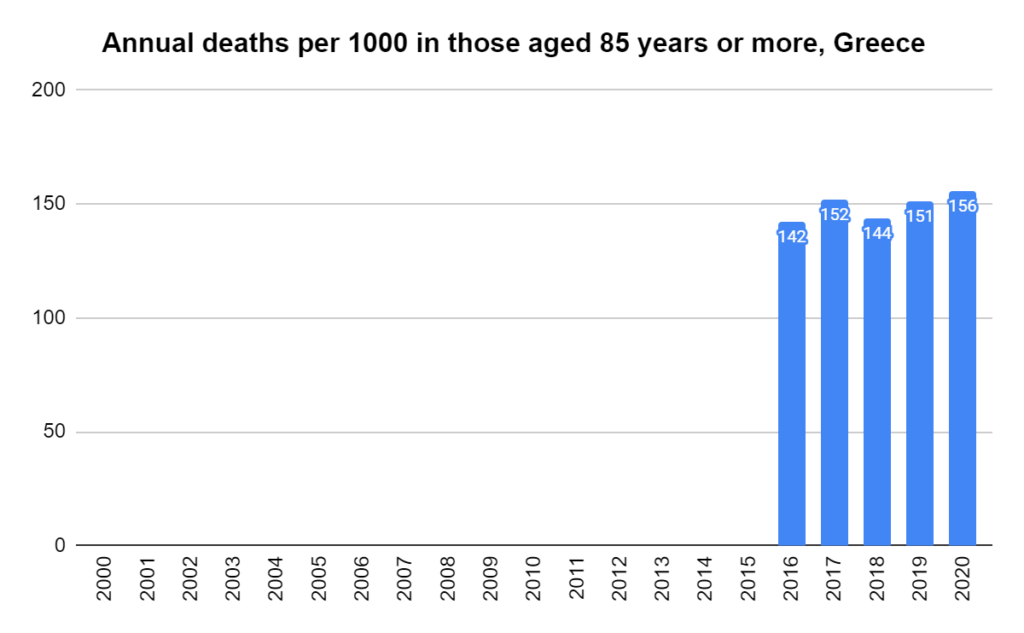
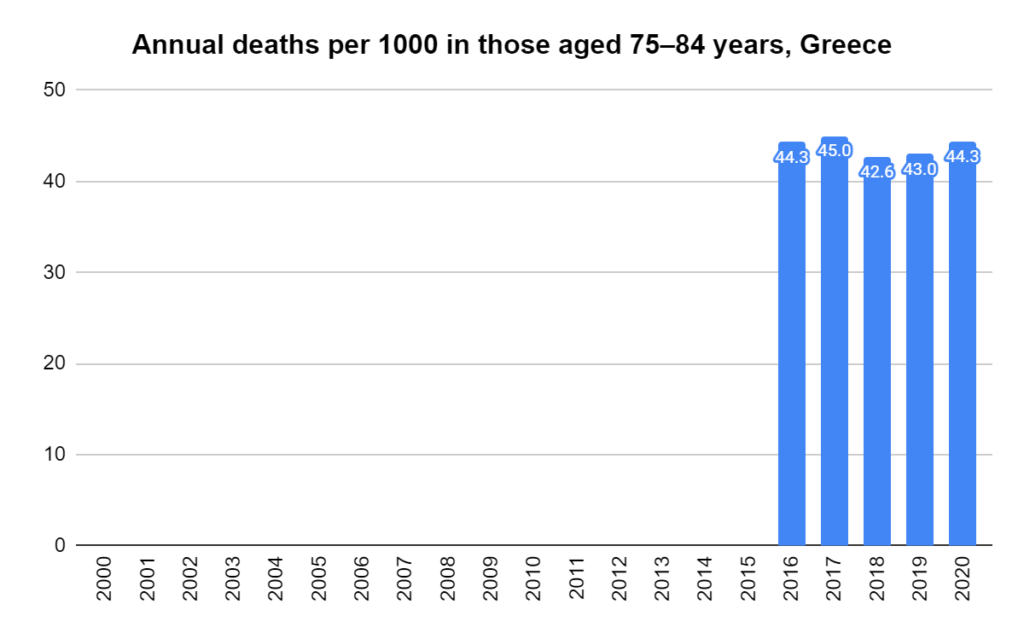
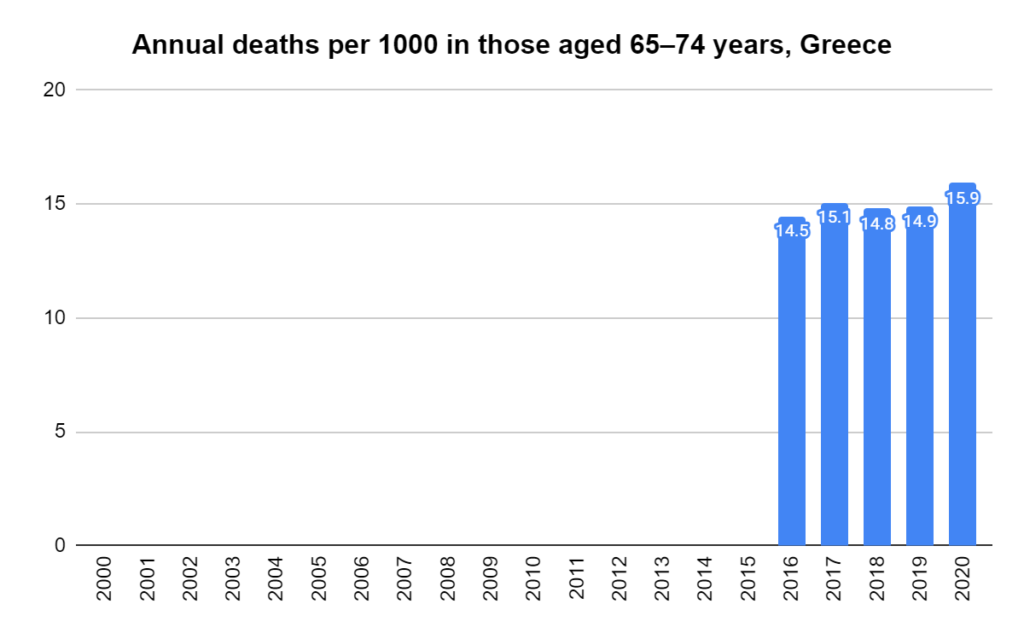
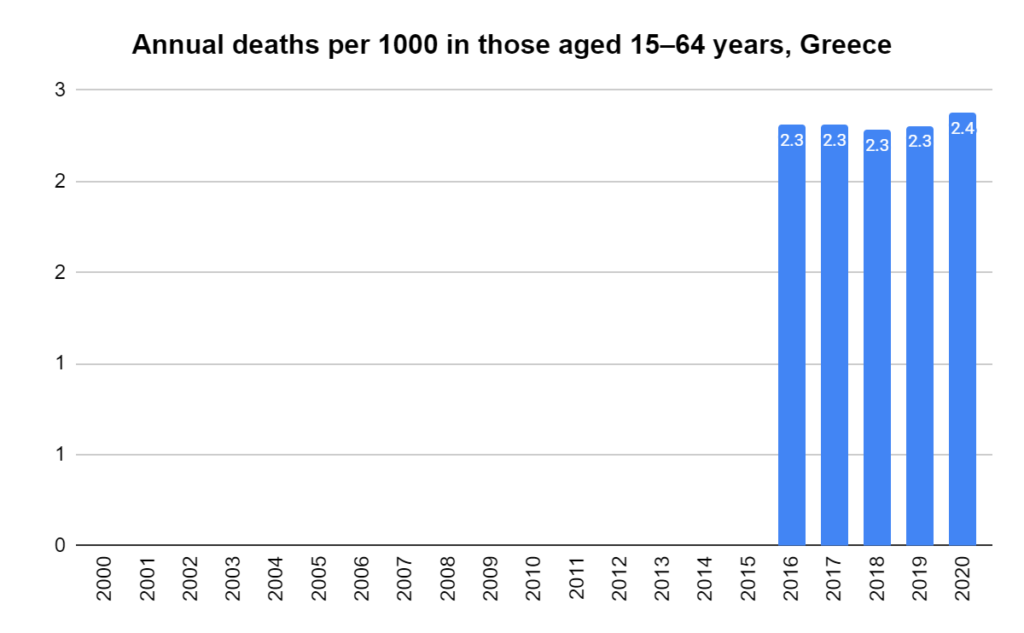
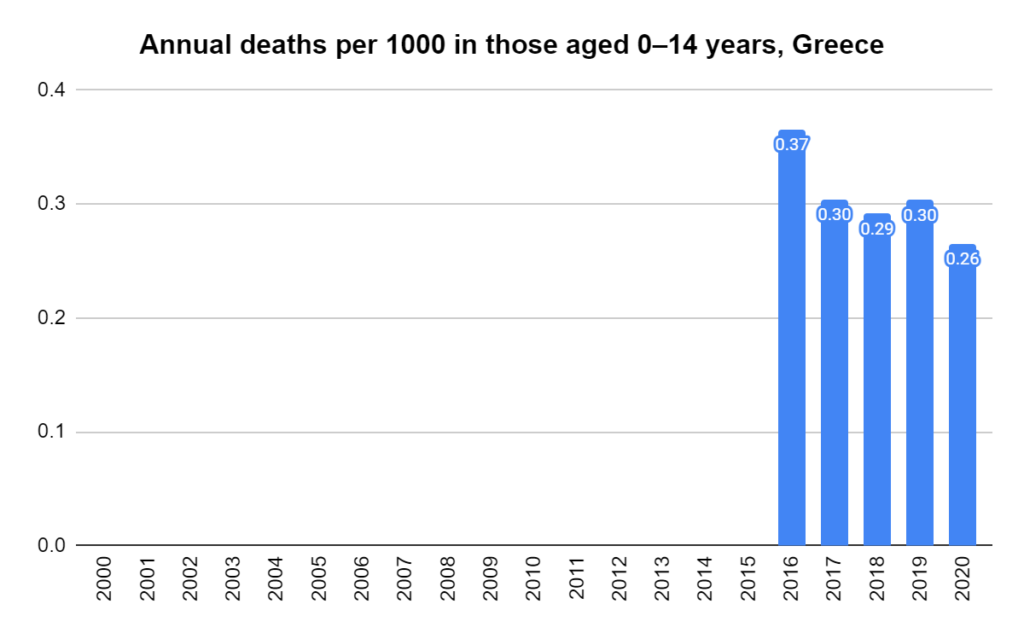
Deaths per 1000 per year in Greece, ages 85 years and over. Derived using data from the Human Mortality Database. Calculations and methodsDeaths per 1000 per year in Greece, ages 75-84. Derived using data from the Human Mortality Database. Calculations and methodsDeaths per 1000 per year in Greece, ages 65-74. Derived using data from the Human Mortality Database. Calculations and methodsDeaths per 1000 per year in Greece, ages 15-64. Derived using data from the Human Mortality Database. Calculations and methodsDeaths per 1000 per year in Greece, ages 0-14. Derived using data from the Human Mortality Database. Calculations and methods
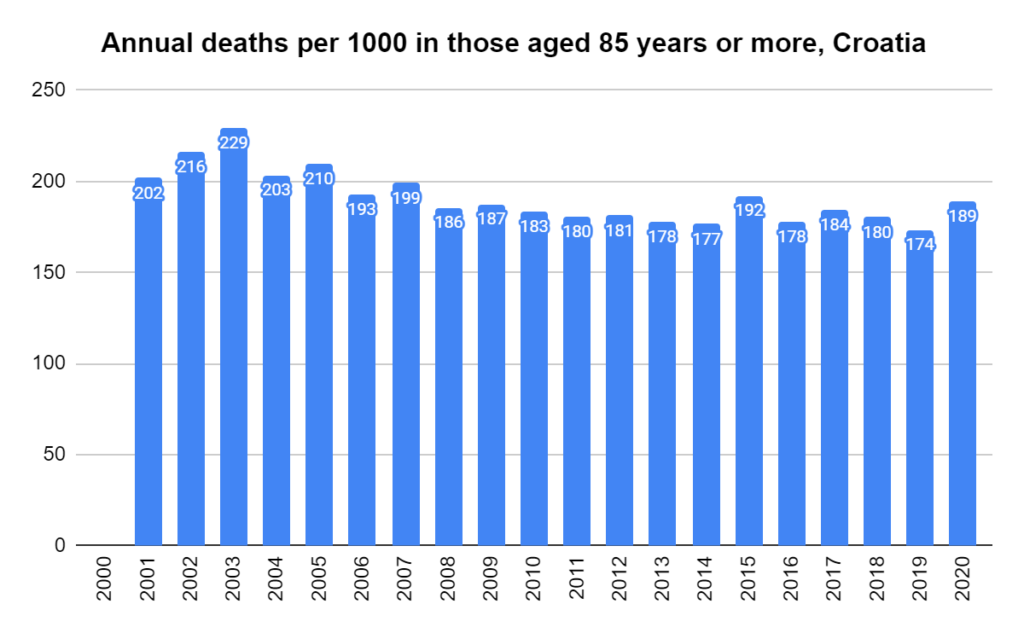
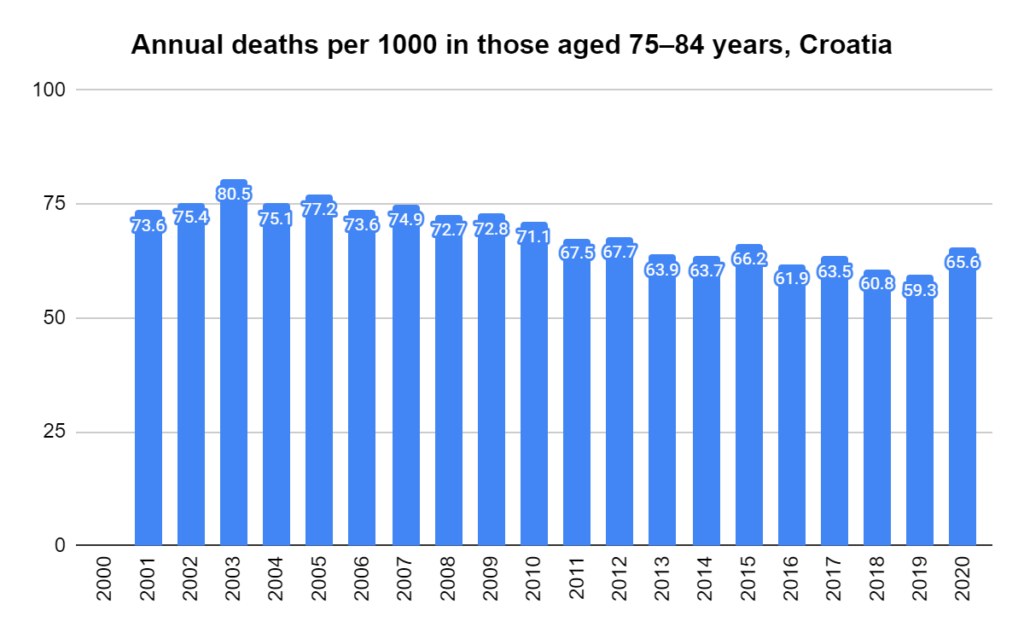
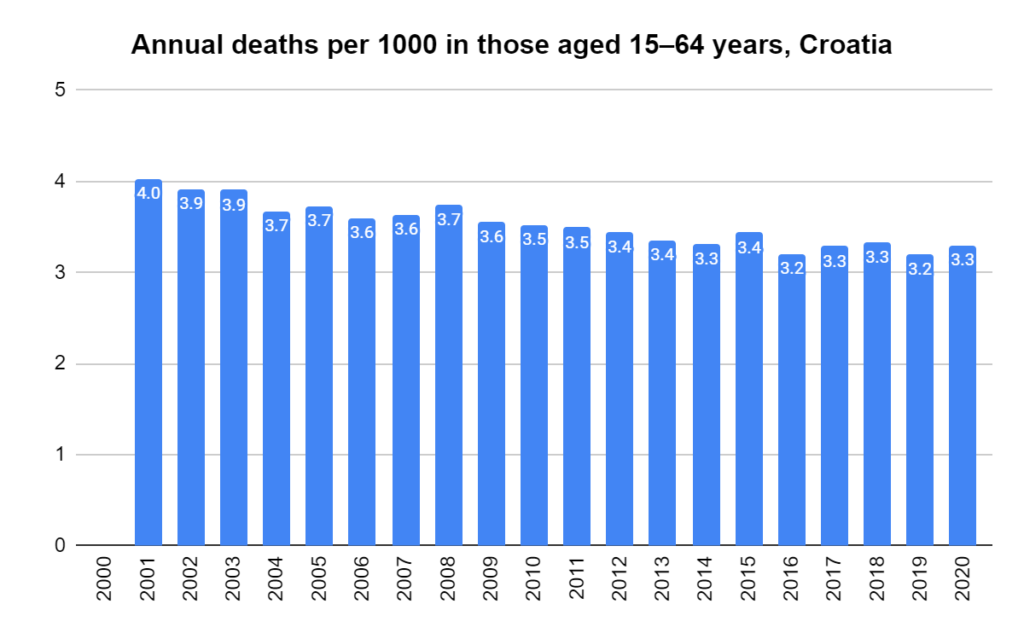
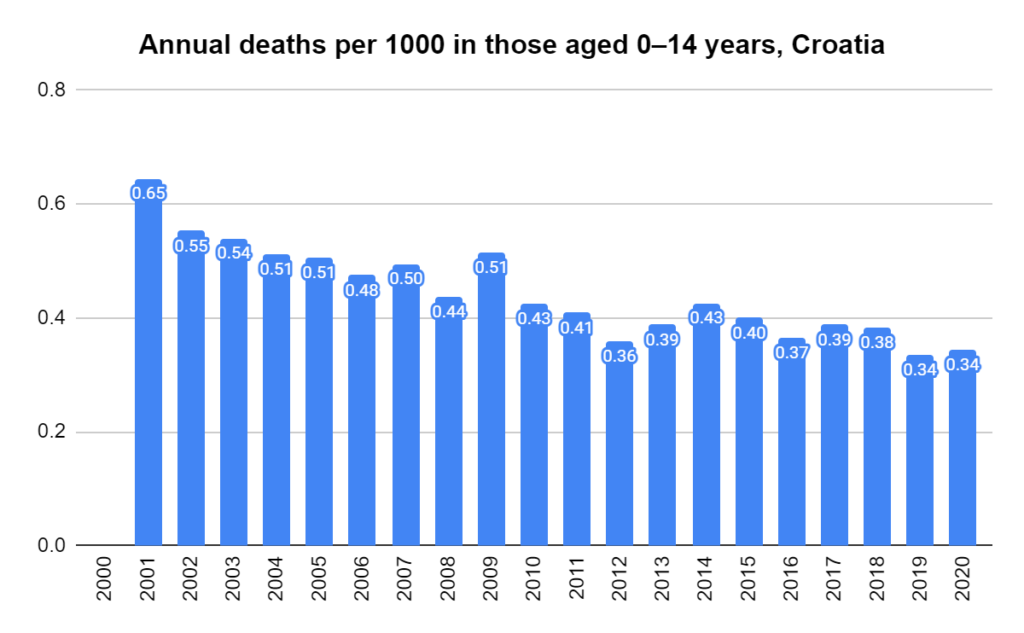
Deaths per 1000 per year in Croatia, ages 85 years and over. Derived using data from the Human Mortality Database. Calculations and methodsDeaths per 1000 per year in Croatia, ages 75-84. Derived using data from the Human Mortality Database. Calculations and methodsDeaths per 1000 per year in Croatia, ages 65-74. Derived using data from the Human Mortality Database. Calculations and methodsDeaths per 1000 per year in Croatia, ages 15-64. Derived using data from the Human Mortality Database. Calculations and methodsDeaths per 1000 per year in Croatia, ages 0-14. Derived using data from the Human Mortality Database. Calculations and methods
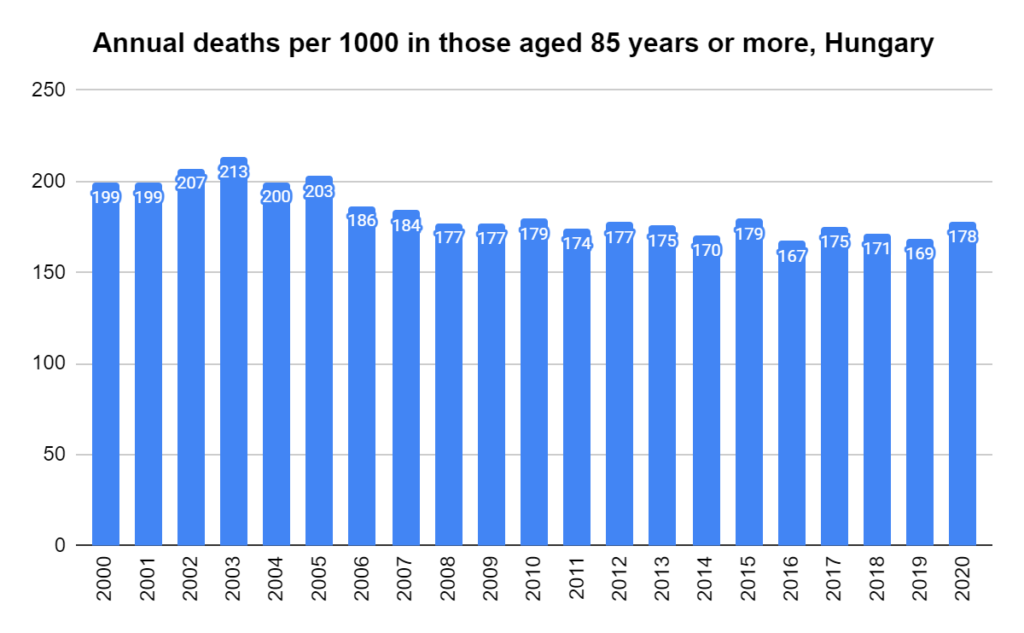
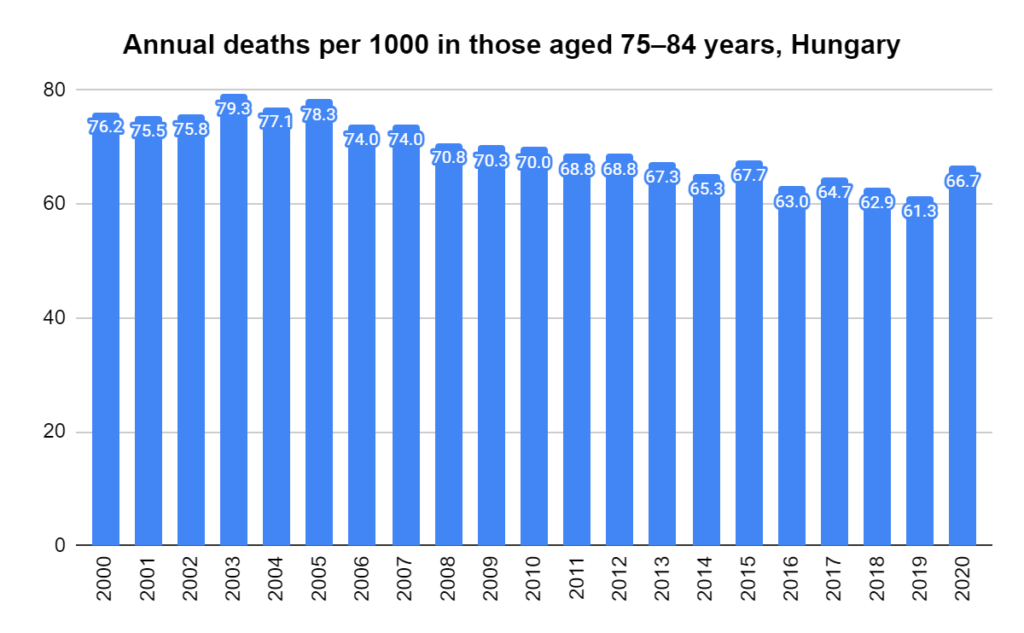
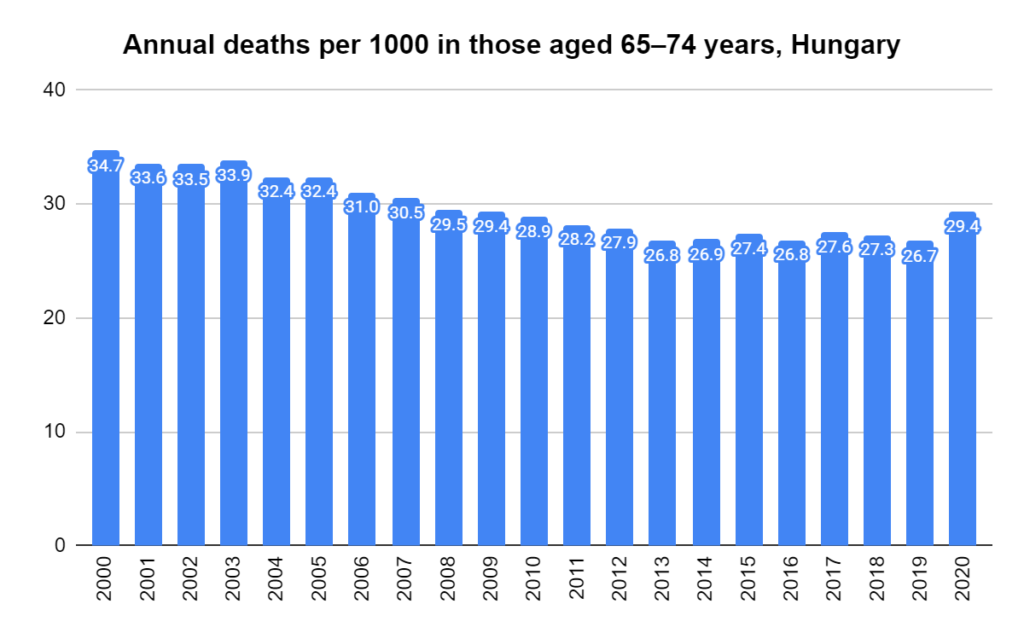
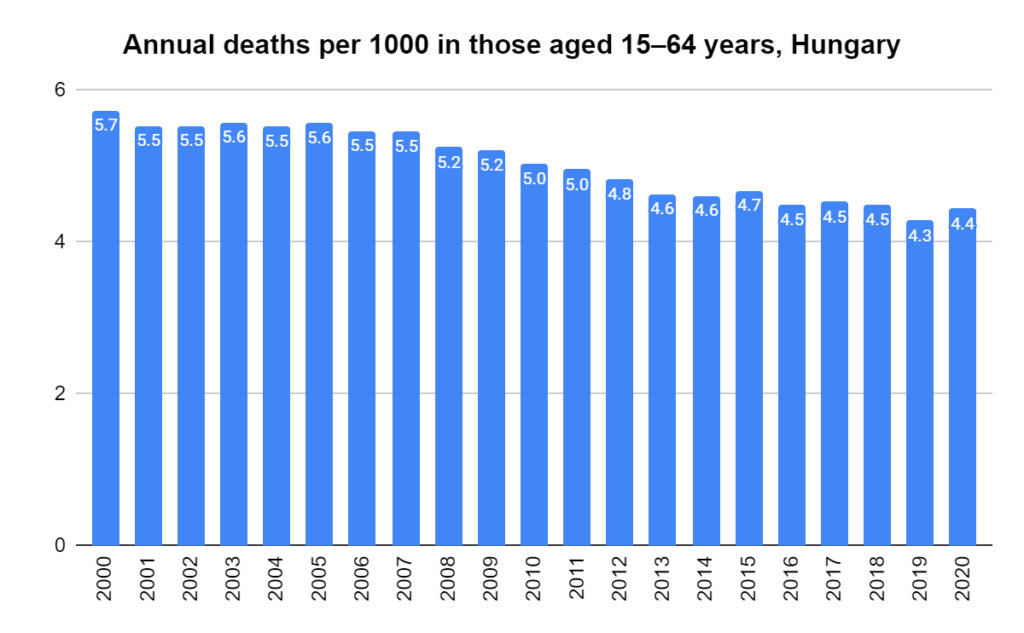
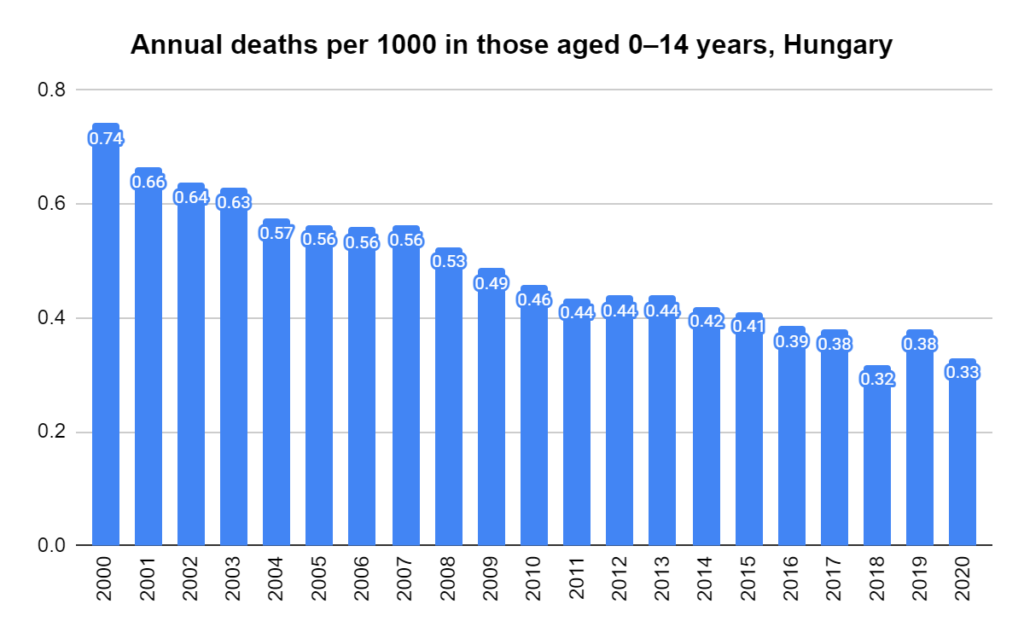
Deaths per 1000 per year in Hungary, ages 85 years and over. Derived using data from the Human Mortality Database. Calculations and methodsDeaths per 1000 per year in Hungary, ages 75-84. Derived using data from the Human Mortality Database. Calculations and methodsDeaths per 1000 per year in Hungary, ages 65-74. Derived using data from the Human Mortality Database. Calculations and methodsDeaths per 1000 per year in Hungary, ages 15-64. Derived using data from the Human Mortality Database. Calculations and methodsDeaths per 1000 per year in Hungary, ages 0-14. Derived using data from the Human Mortality Database. Calculations and methods
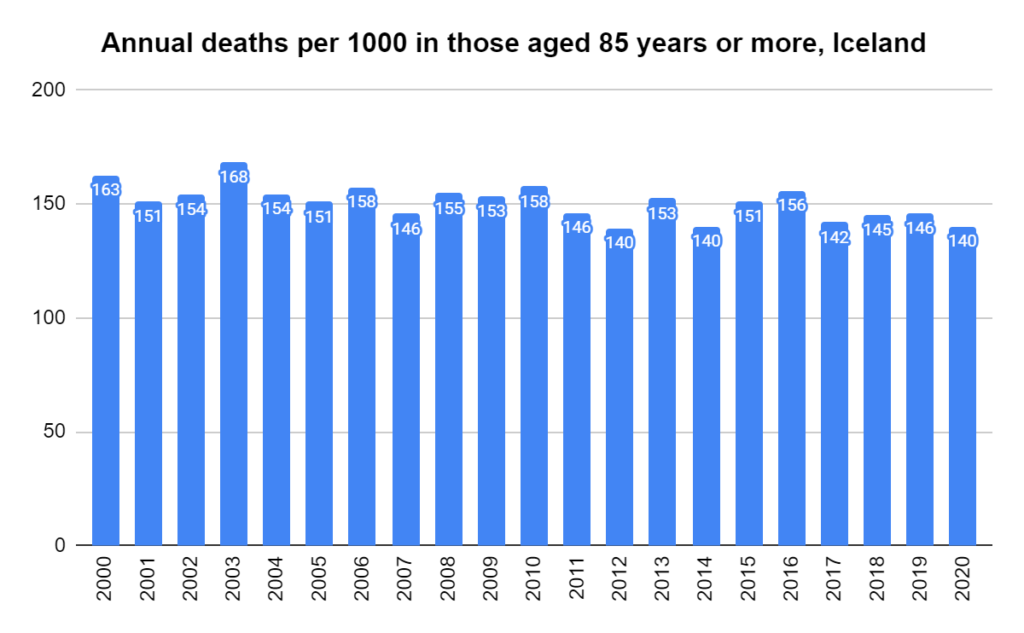
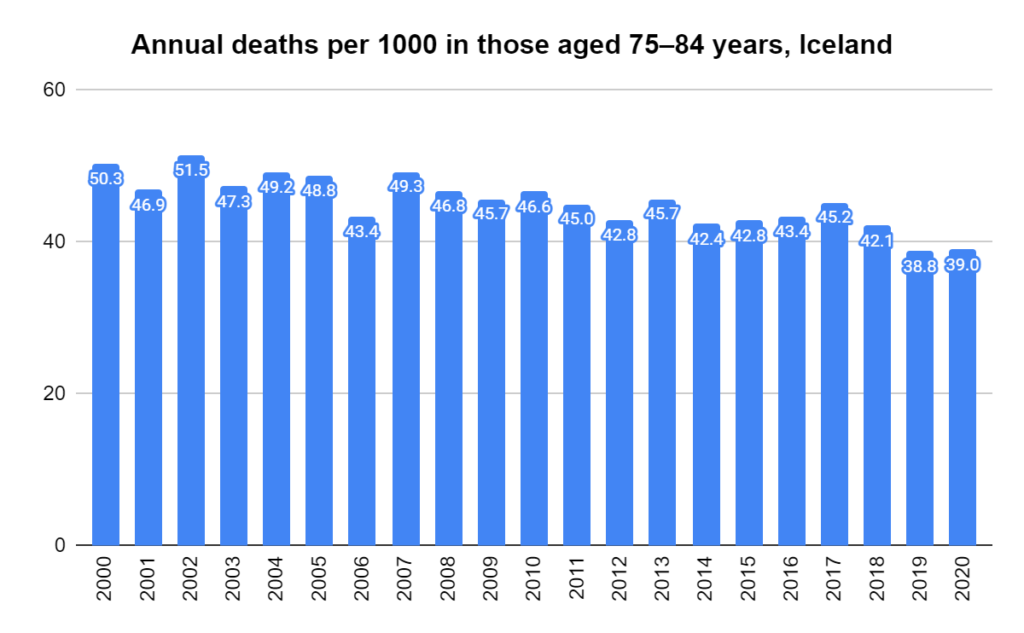
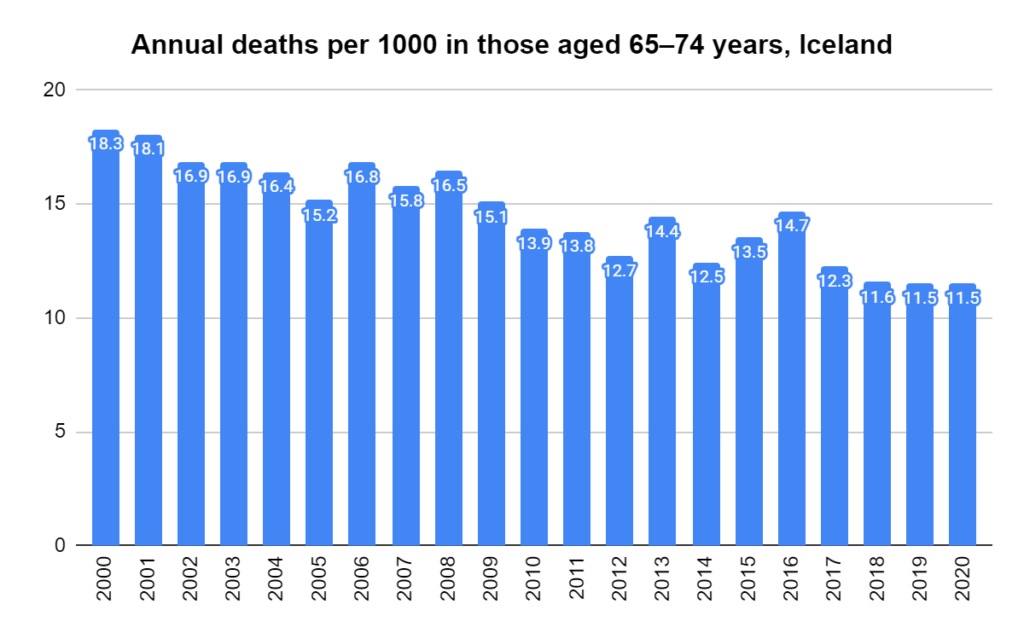
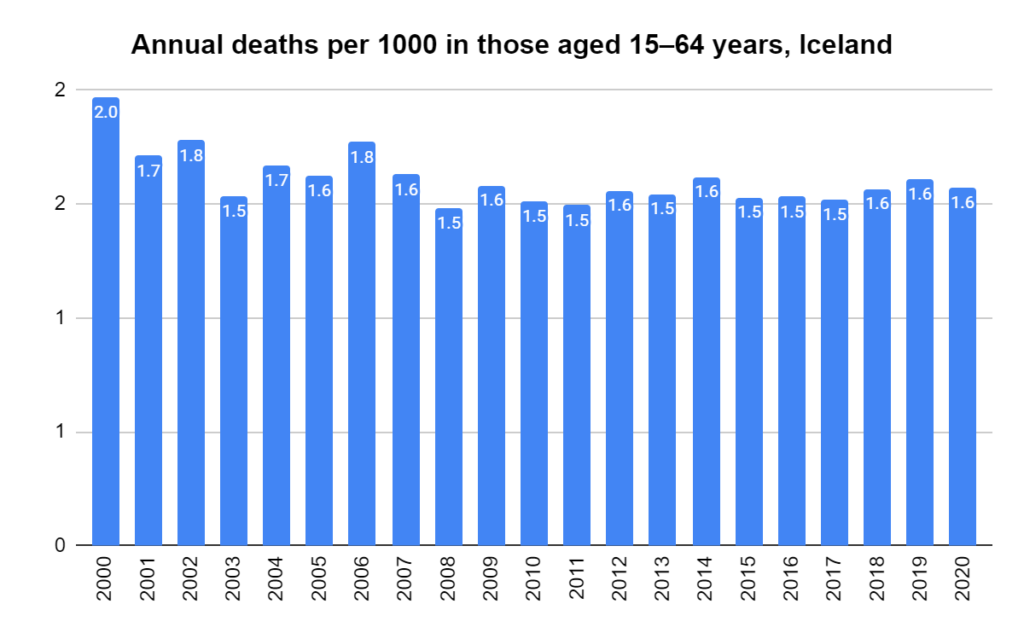
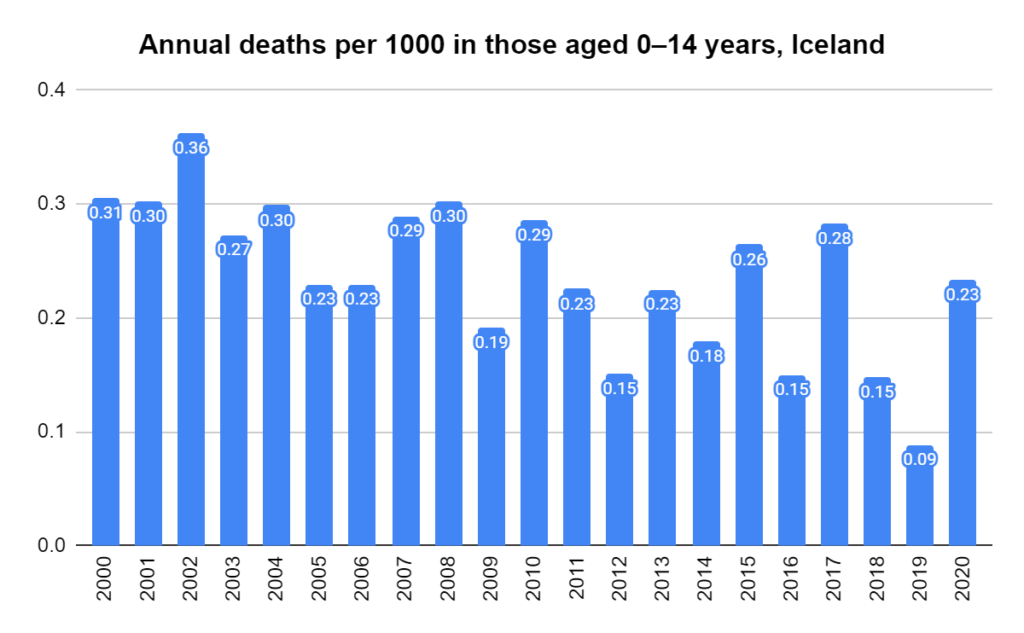
Deaths per 1000 per year in Iceland, ages 85 years and over. Derived using data from the Human Mortality Database. Calculations and methodsDeaths per 1000 per year in Iceland, ages 75-84. Derived using data from the Human Mortality Database. Calculations and methodsDeaths per 1000 per year in Iceland, ages 65-74. Derived using data from the Human Mortality Database. Calculations and methodsDeaths per 1000 per year in Iceland, ages 15-64. Derived using data from the Human Mortality Database. Calculations and methodsDeaths per 1000 per year in Iceland, ages 0-14. Derived using data from the Human Mortality Database. Calculations and methods
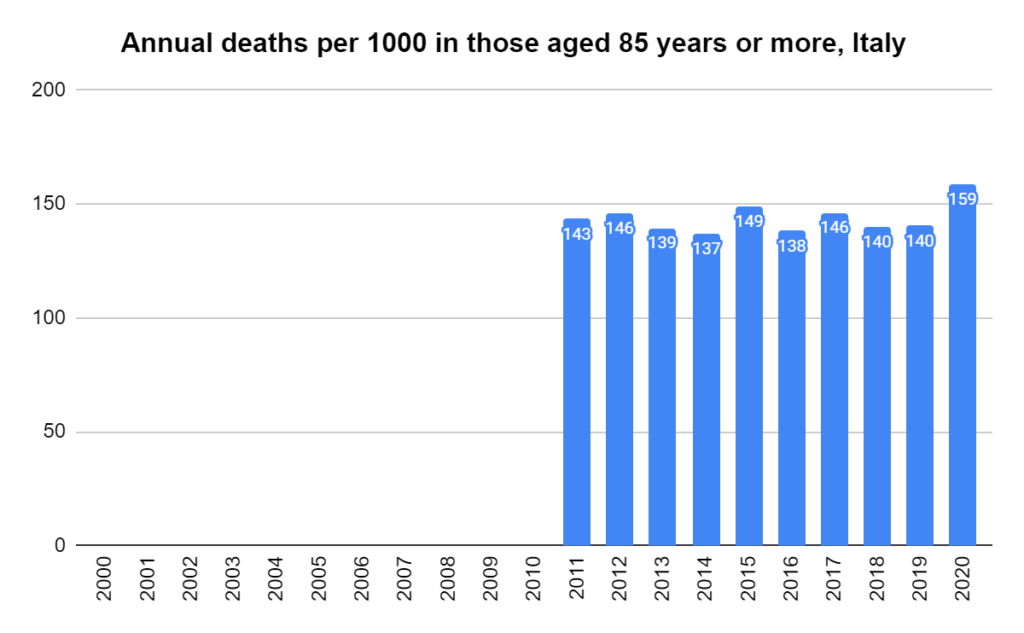
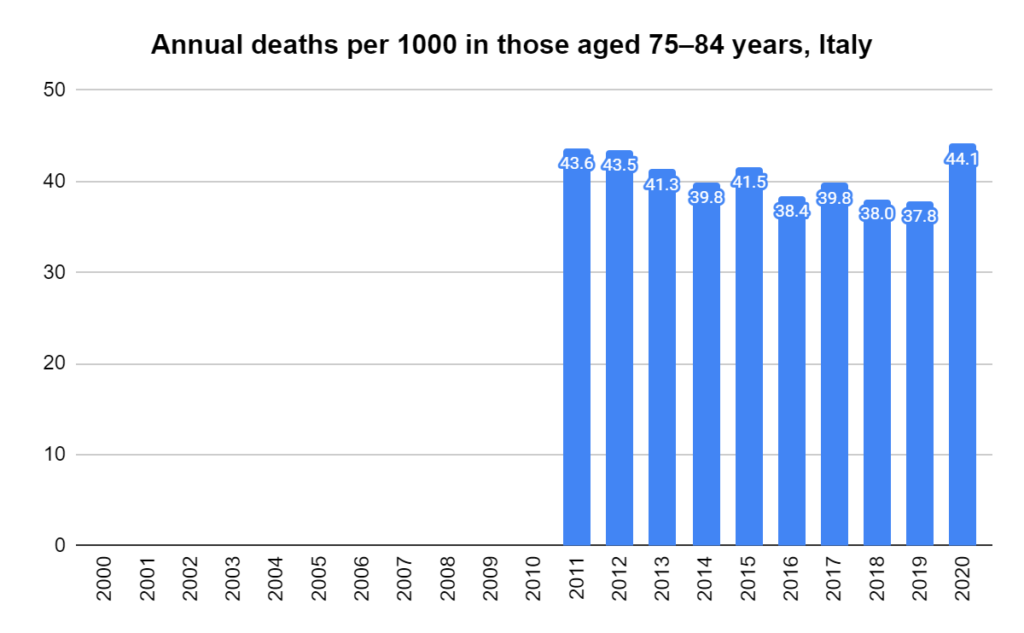
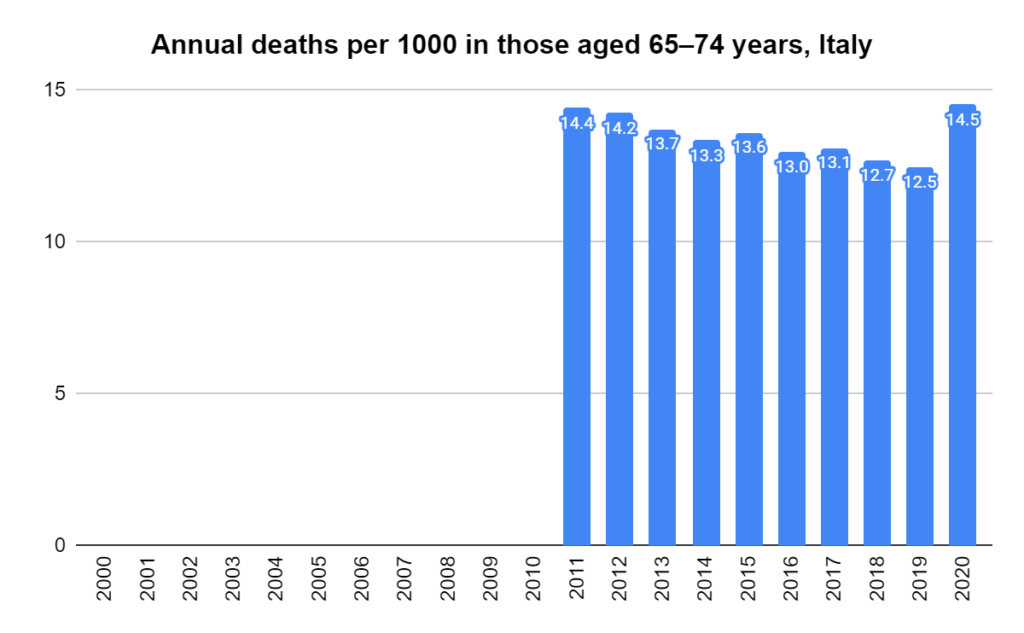
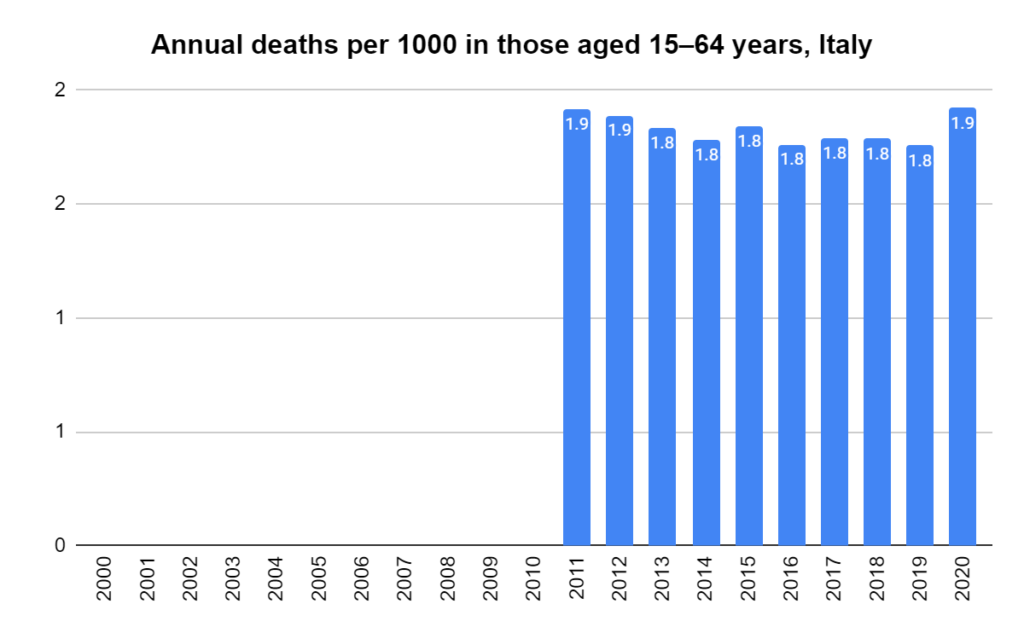
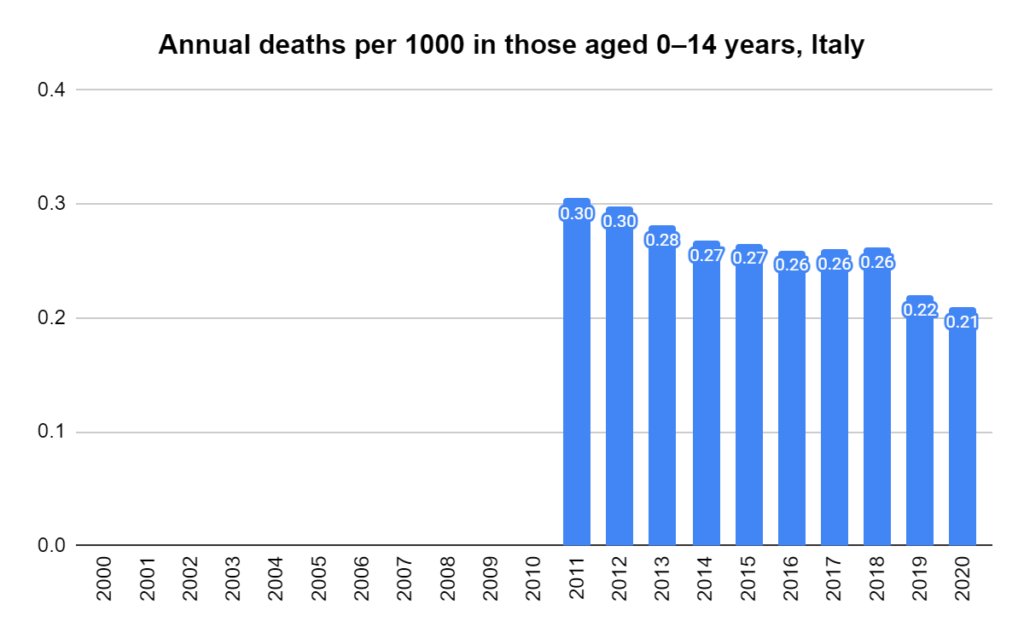
Deaths per 1000 per year in Italy, ages 85 years and over. Derived using data from the Human Mortality Database. Calculations and methodsDeaths per 1000 per year in Italy, ages 75-84. Derived using data from the Human Mortality Database. Calculations and methodsDeaths per 1000 per year in Italy, ages 65-74. Derived using data from the Human Mortality Database. Calculations and methodsDeaths per 1000 per year in Italy, ages 15-64. Derived using data from the Human Mortality Database. Calculations and methodsDeaths per 1000 per year in Italy, ages 0-14. Derived using data from the Human Mortality Database. Calculations and methods
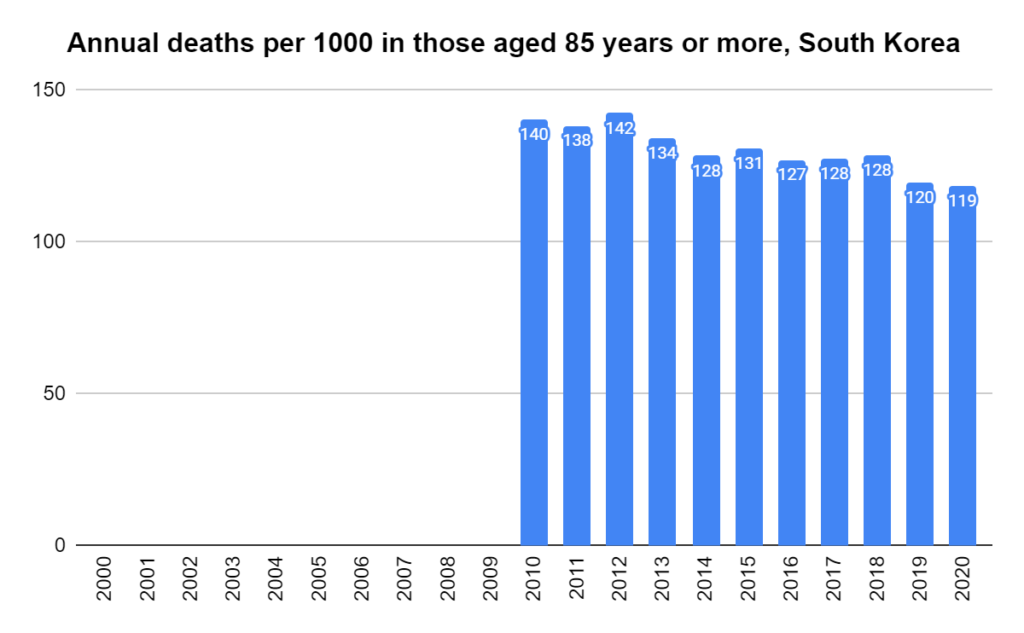
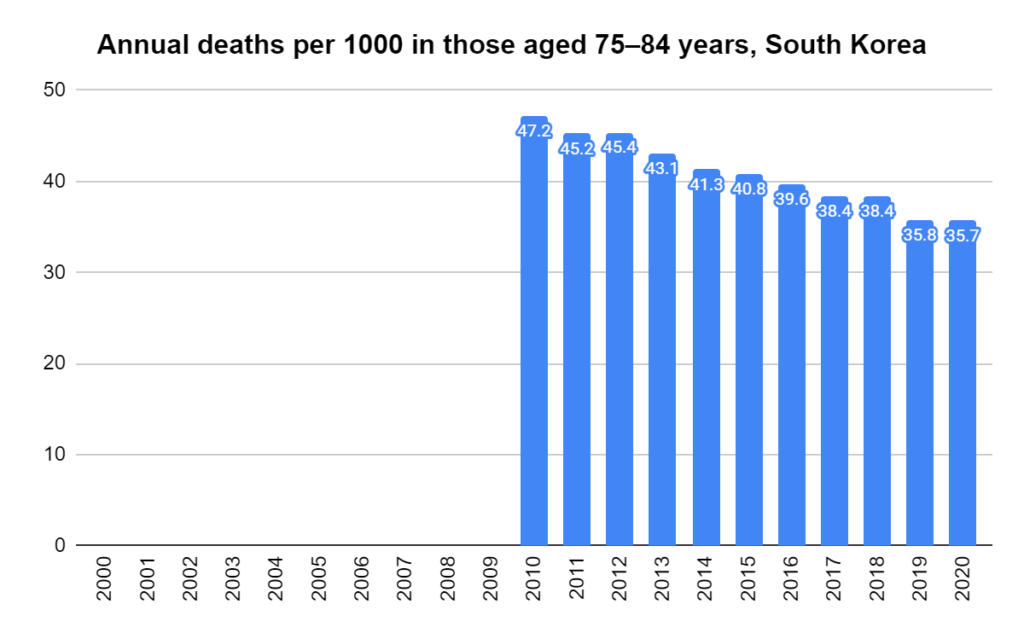
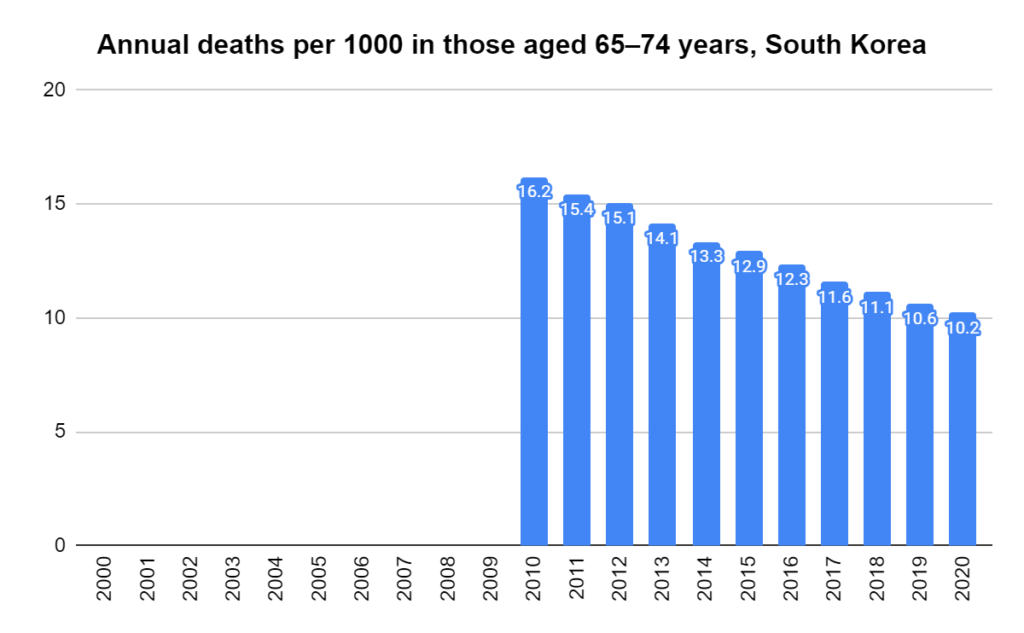
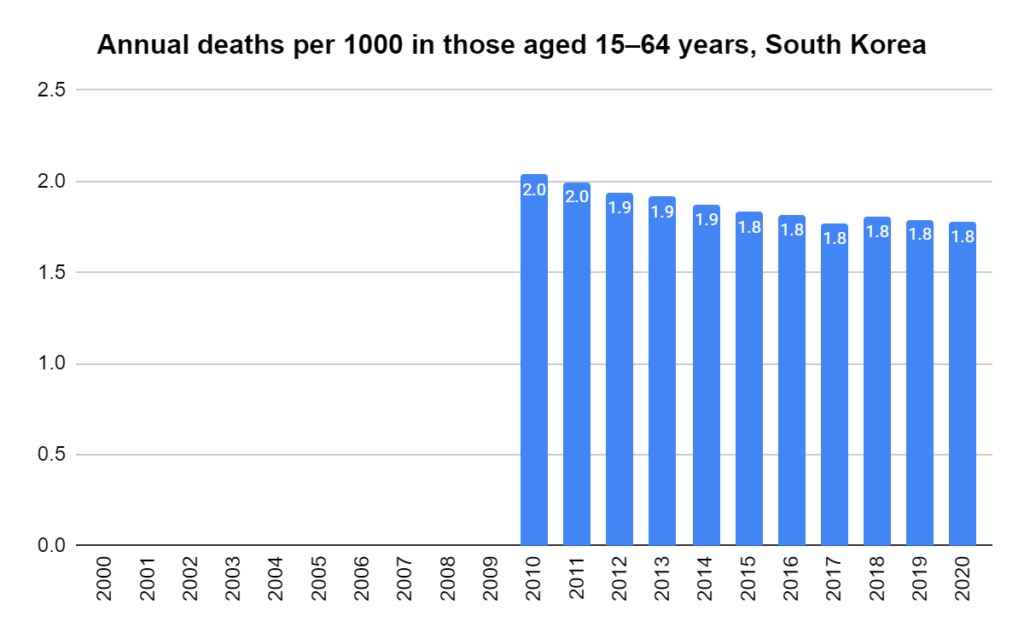
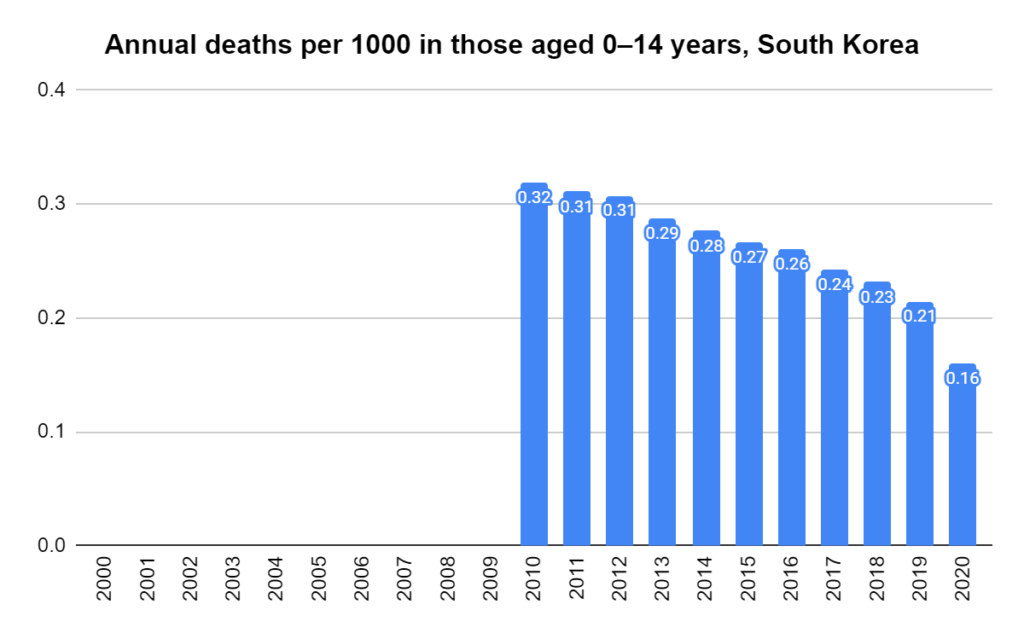
Deaths per 1000 per year in South Korea, ages 85 years and over. Derived using data from the Human Mortality Database. Calculations and methodsDeaths per 1000 per year in South Korea, ages 75-84. Derived using data from the Human Mortality Database. Calculations and methodsDeaths per 1000 per year in South Korea, ages 65-74. Derived using data from the Human Mortality Database. Calculations and methodsDeaths per 1000 per year in South Korea, ages 15-64. Derived using data from the Human Mortality Database. Calculations and methodsDeaths per 1000 per year in South Korea, ages 0-14. Derived using data from the Human Mortality Database. Calculations and methods
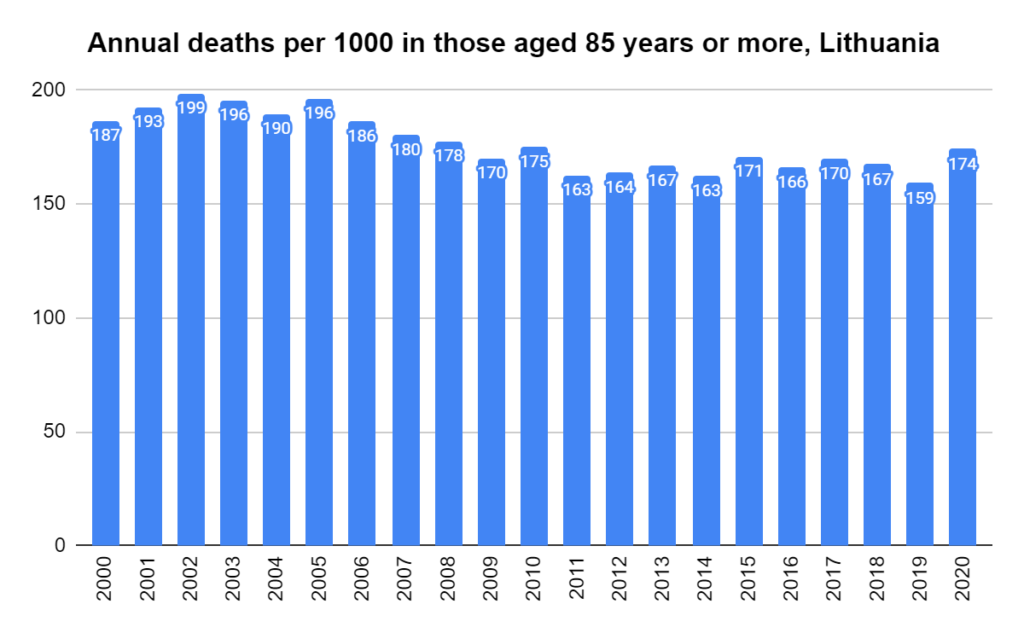
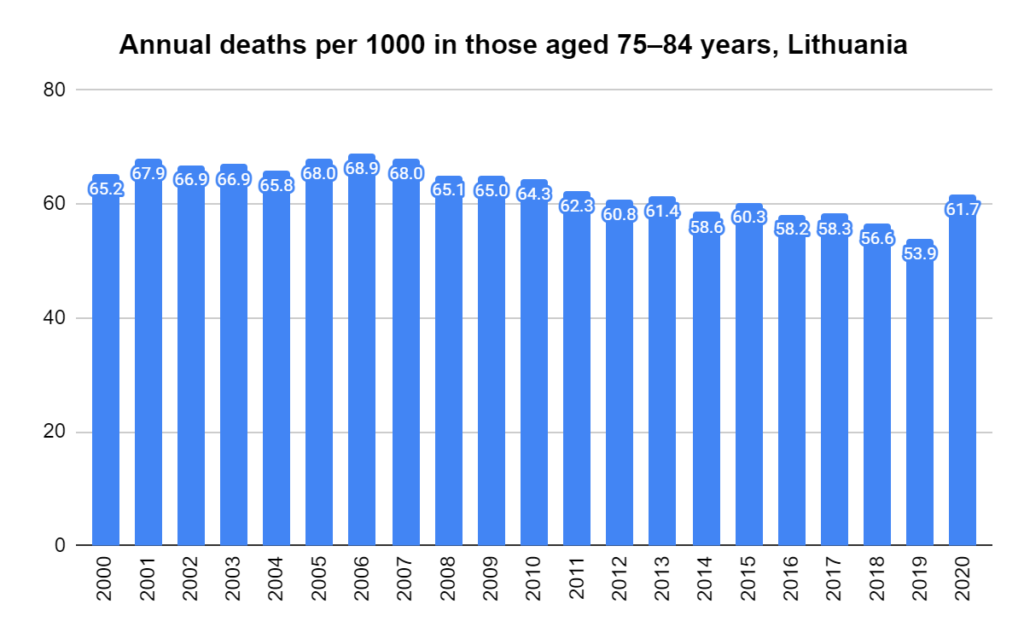
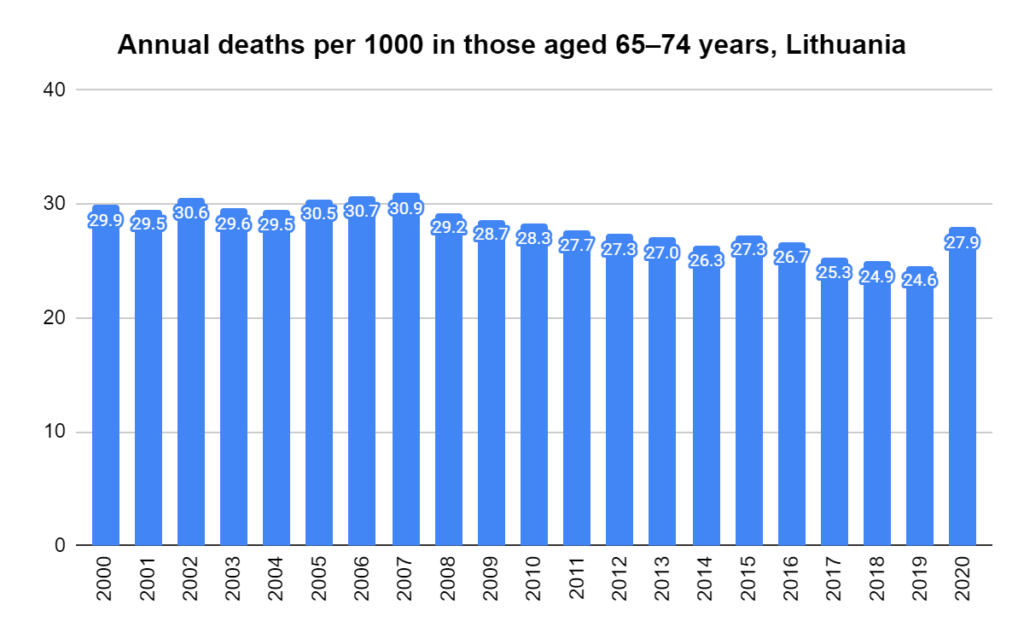
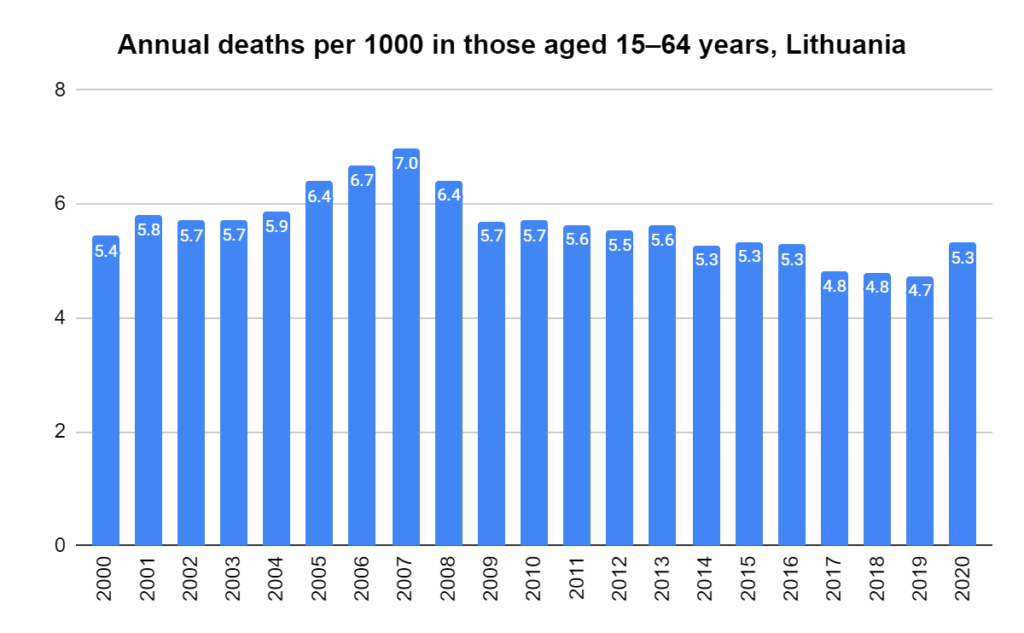
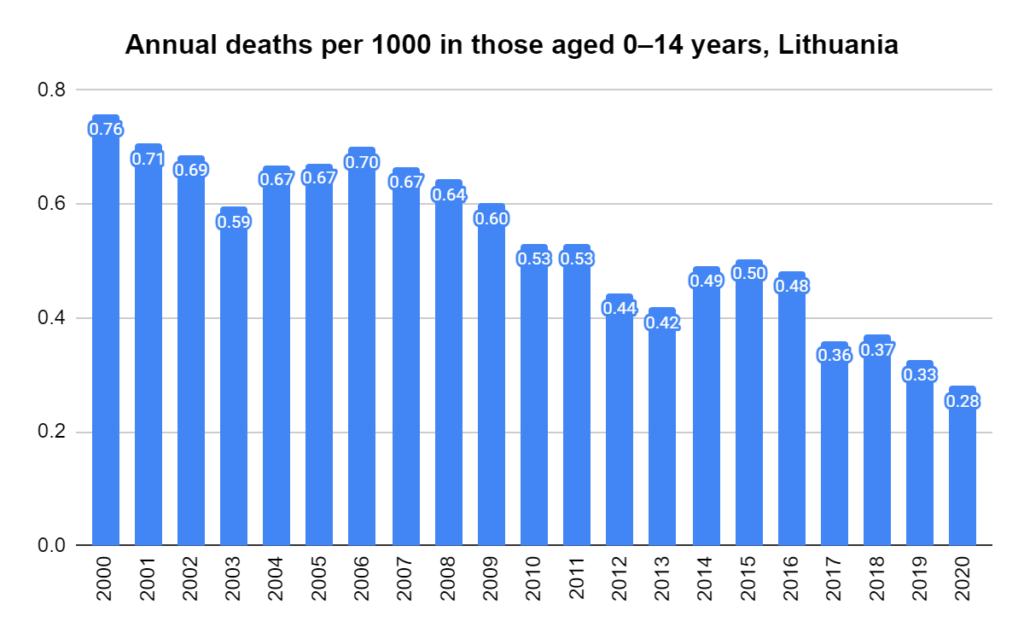
Deaths per 1000 per year in Lithuania, ages 85 years and over. Derived using data from the Human Mortality Database. Calculations and methodsDeaths per 1000 per year in Lithuania, ages 75-84. Derived using data from the Human Mortality Database. Calculations and methodsDeaths per 1000 per year in Lithuania, ages 65-74. Derived using data from the Human Mortality Database. Calculations and methodsDeaths per 1000 per year in Lithuania, ages 15-64. Derived using data from the Human Mortality Database. Calculations and methodsDeaths per 1000 per year in Lithuania, ages 0-14. Derived using data from the Human Mortality Database. Calculations and methods
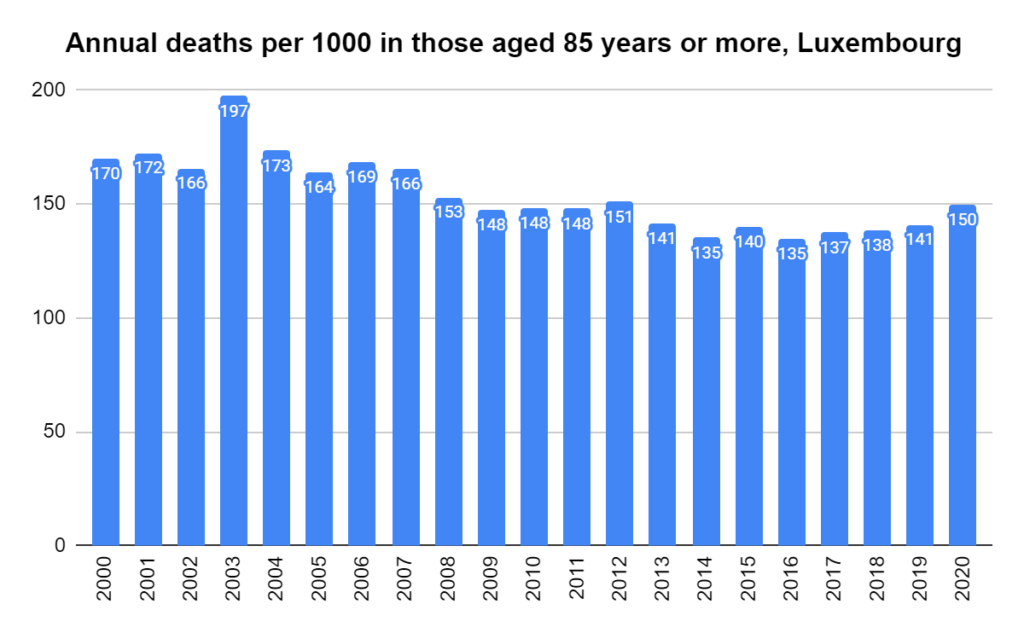
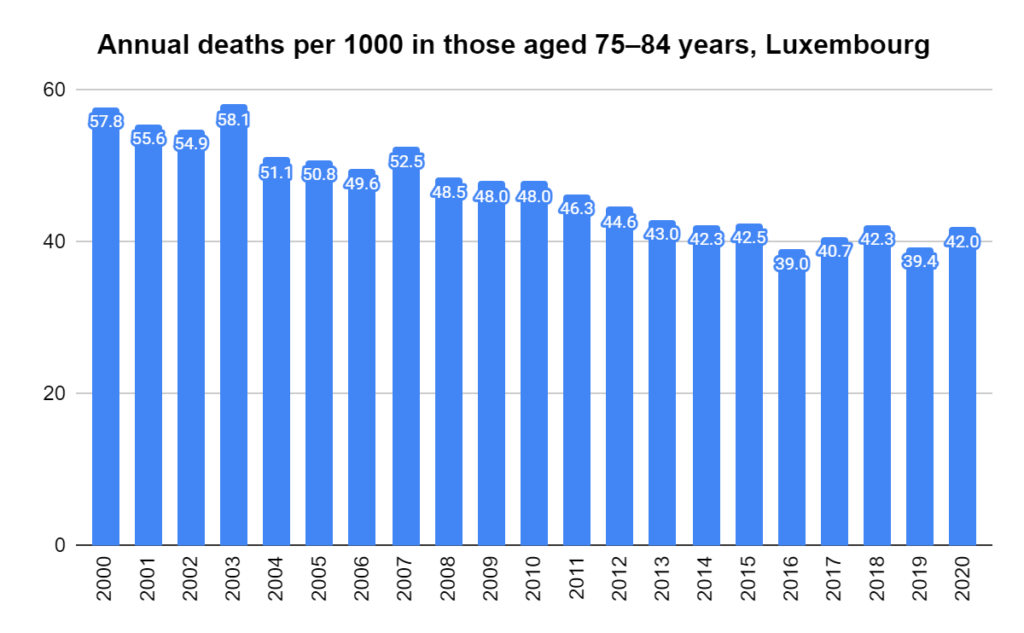
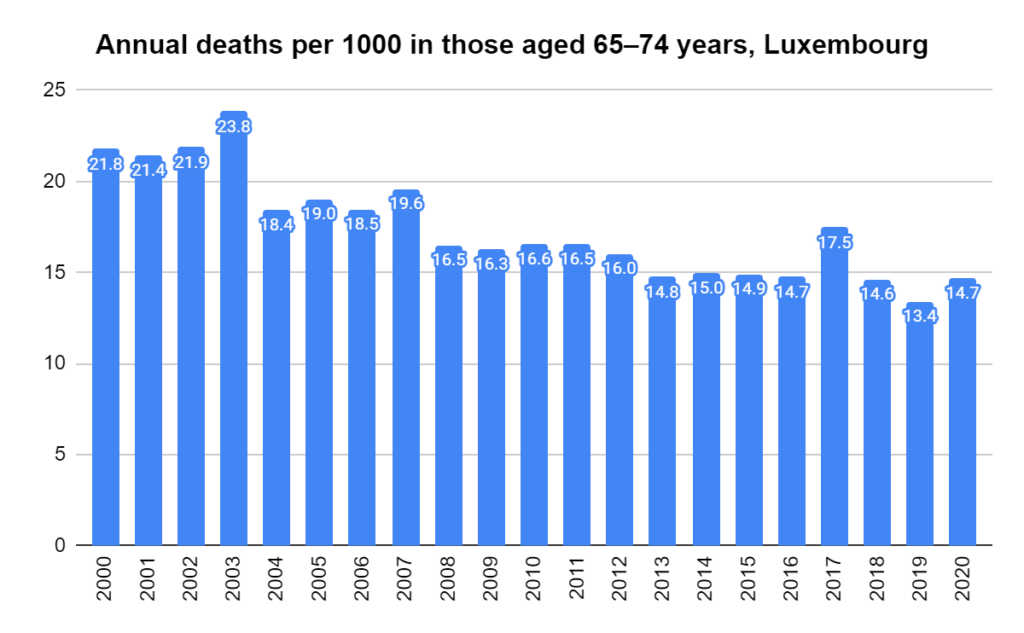
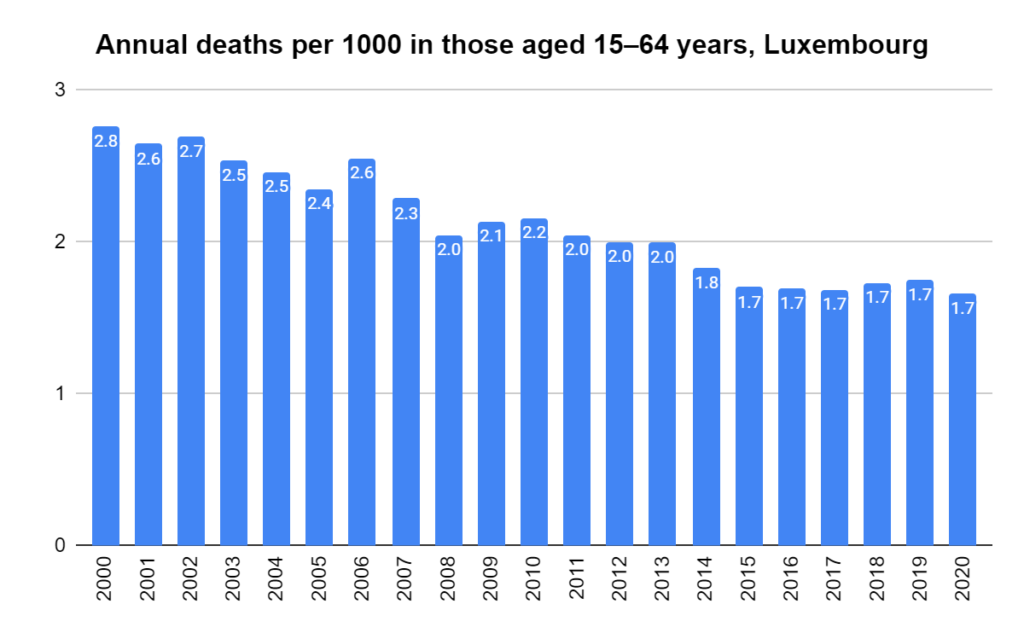
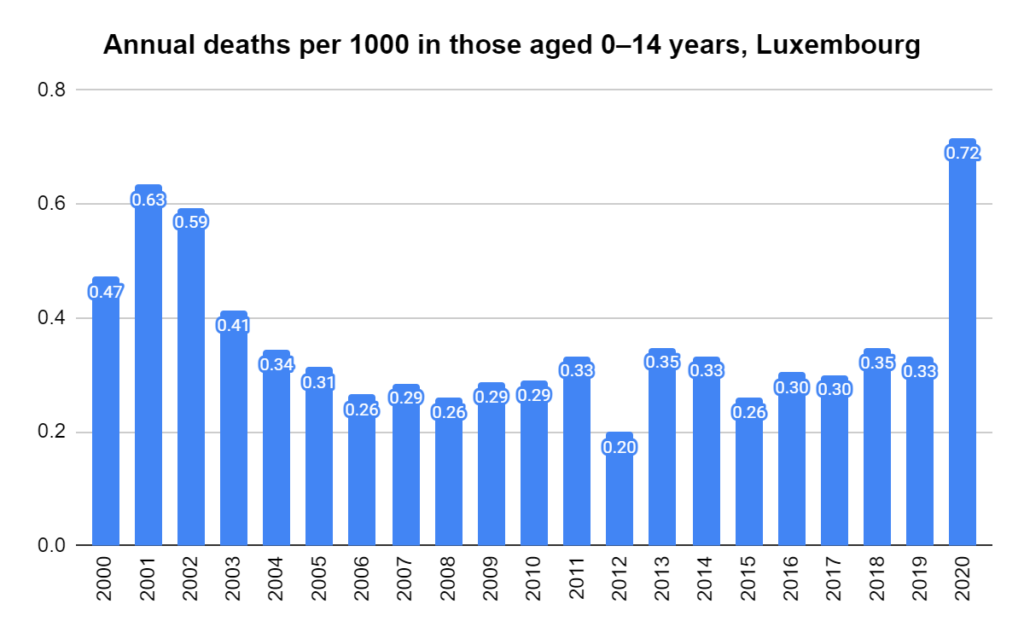
Deaths per 1000 per year in Luxembourg, ages 85 years and over. Derived using data from the Human Mortality Database. Calculations and methodsDeaths per 1000 per year in Luxembourg, ages 75-84. Derived using data from the Human Mortality Database. Calculations and methodsDeaths per 1000 per year in Luxembourg, ages 65-74. Derived using data from the Human Mortality Database. Calculations and methodsDeaths per 1000 per year in Luxembourg, ages 15-64. Derived using data from the Human Mortality Database. Calculations and methodsDeaths per 1000 per year in Luxembourg, ages 0-14. Derived using data from the Human Mortality Database. Calculations and methods
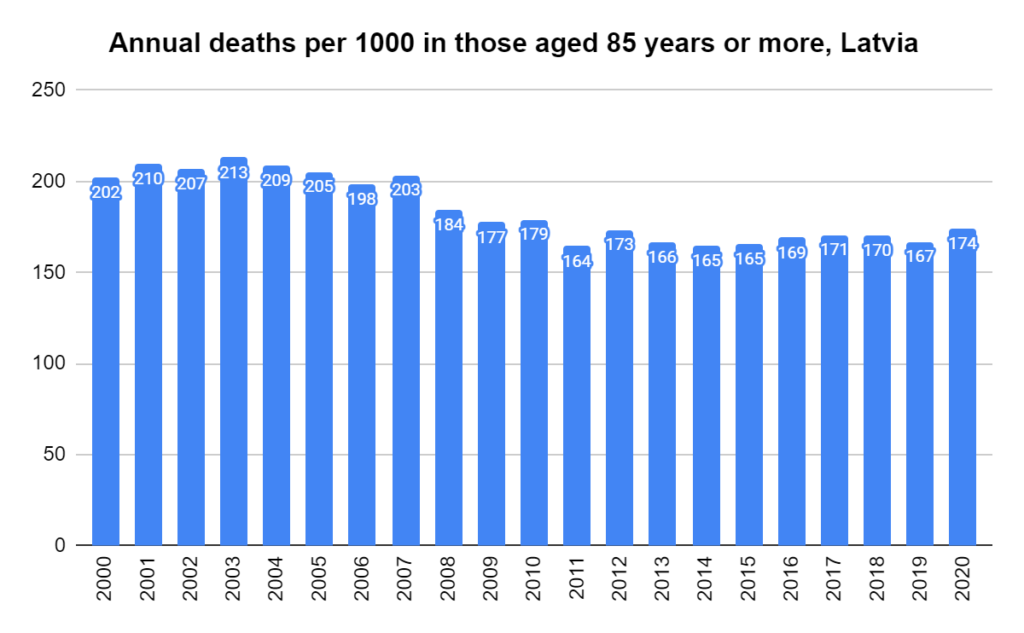
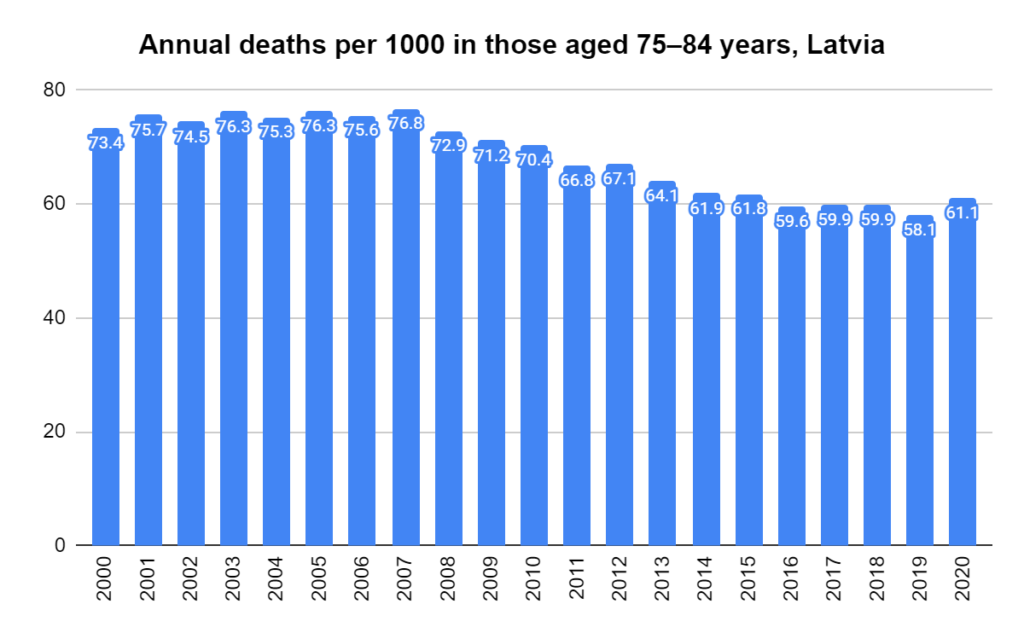
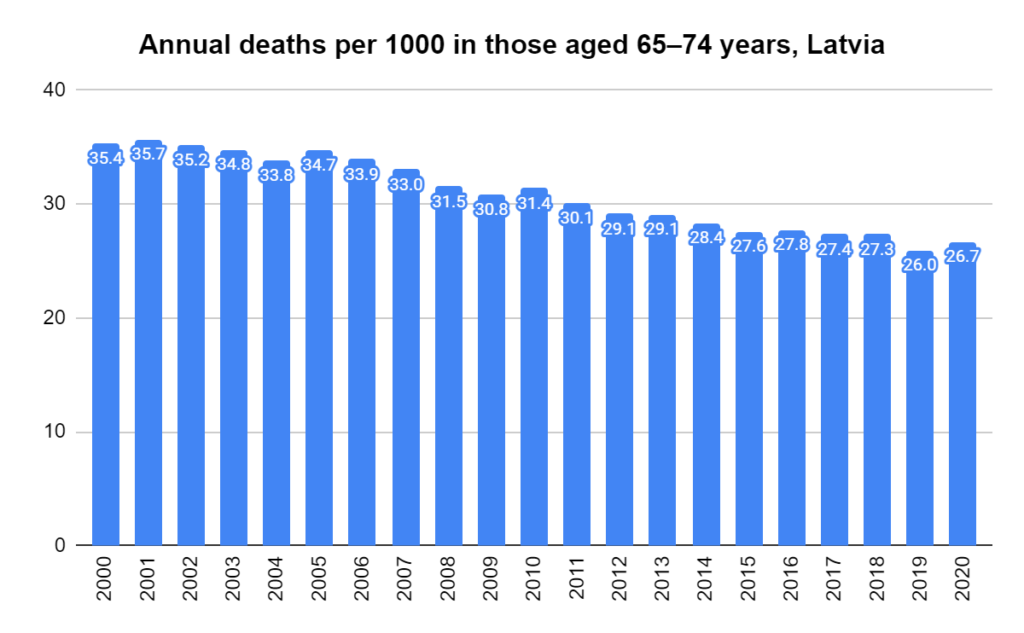
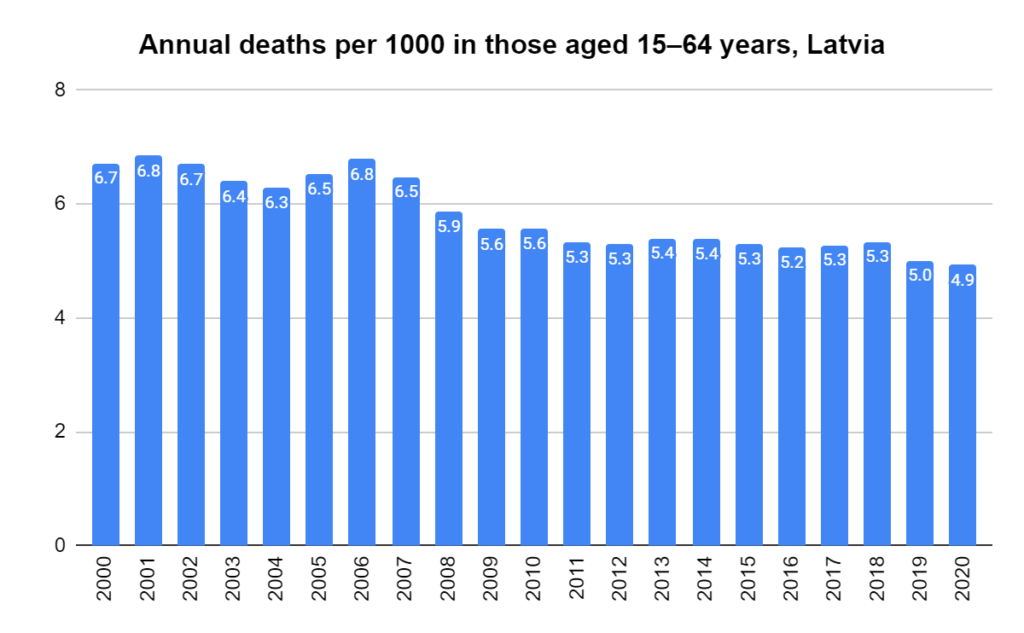
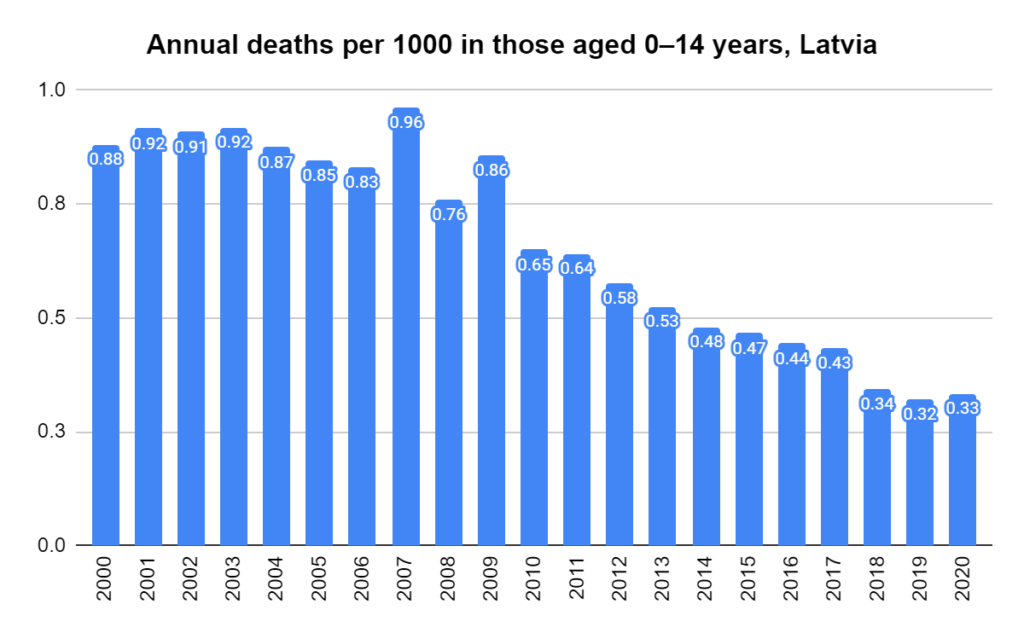
Deaths per 1000 per year in Latvia, ages 85 years and over. Derived using data from the Human Mortality Database. Calculations and methodsDeaths per 1000 per year in Latvia, ages 75-84. Derived using data from the Human Mortality Database. Calculations and methodsDeaths per 1000 per year in Latvia, ages 65-74. Derived using data from the Human Mortality Database. Calculations and methodsDeaths per 1000 per year in Latvia, ages 15-64. Derived using data from the Human Mortality Database. Calculations and methodsDeaths per 1000 per year in Latvia, ages 0-14. Derived using data from the Human Mortality Database. Calculations and methods
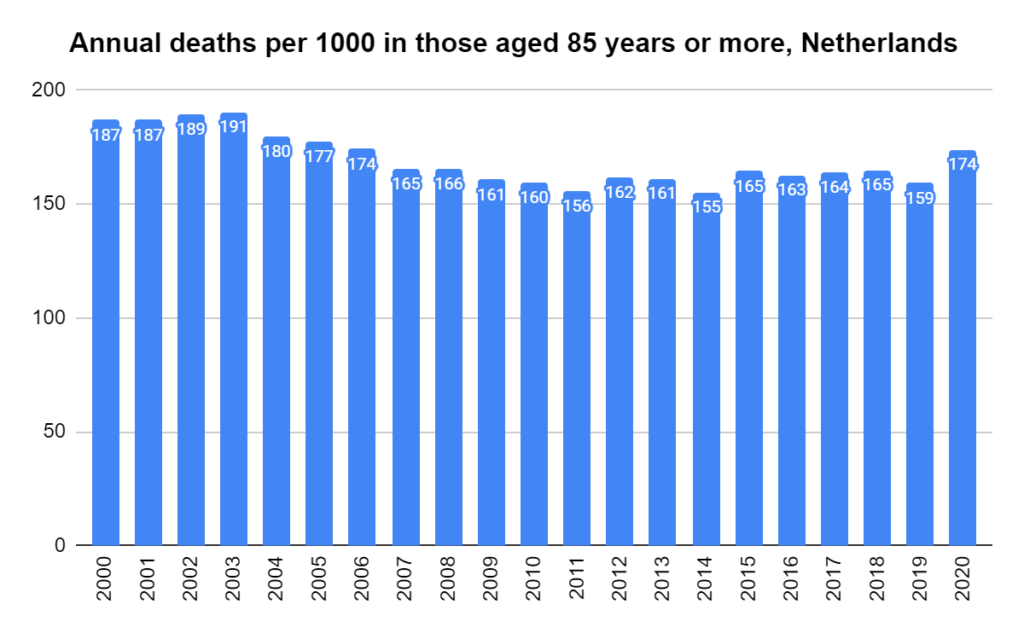
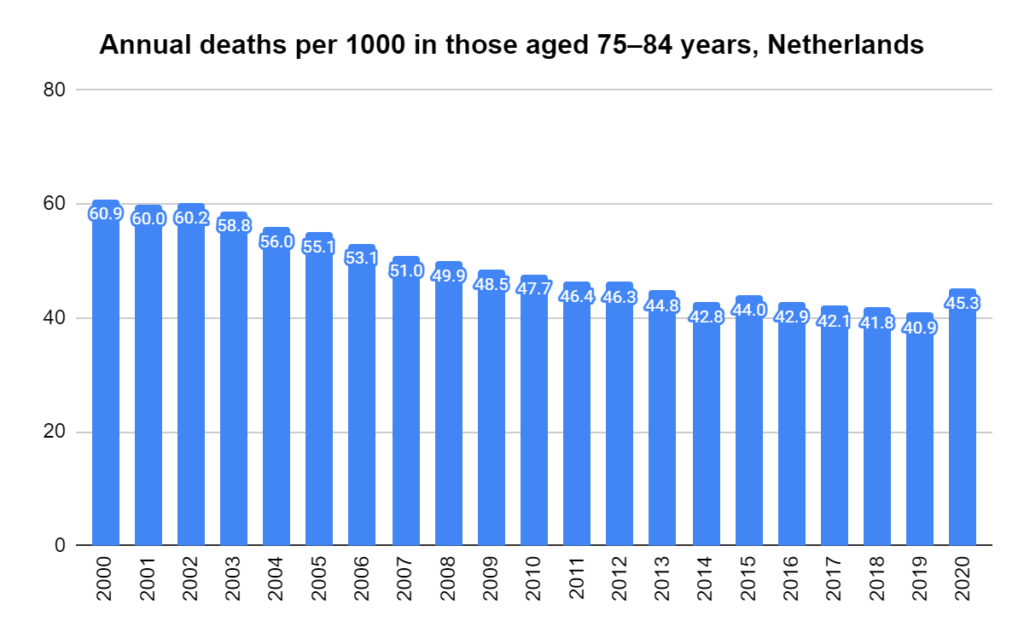
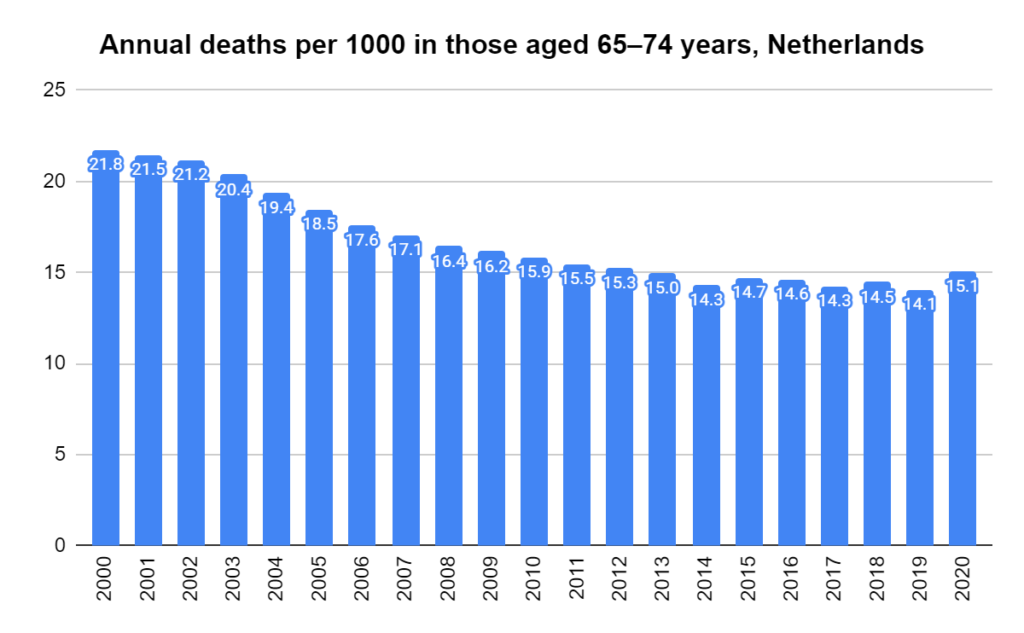
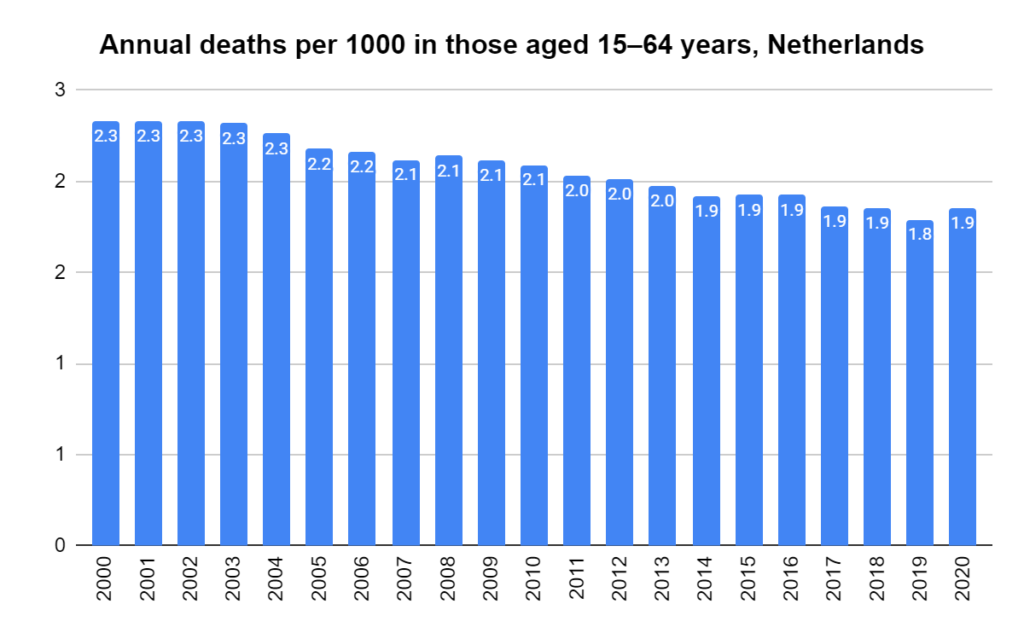
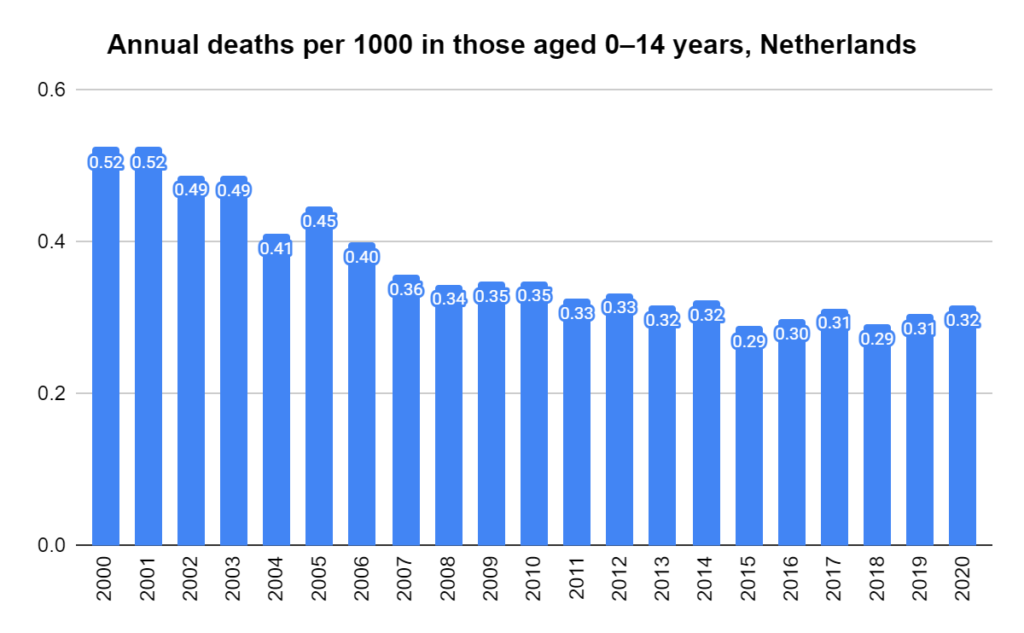
Deaths per 1000 per year in Netherlands, ages 85 years and over. Derived using data from the Human Mortality Database. Calculations and methodsDeaths per 1000 per year in Netherlands, ages 75-84. Derived using data from the Human Mortality Database. Calculations and methodsDeaths per 1000 per year in Netherlands, ages 65-74. Derived using data from the Human Mortality Database. Calculations and methodsDeaths per 1000 per year in Netherlands, ages 15-64. Derived using data from the Human Mortality Database. Calculations and methodsDeaths per 1000 per year in Netherlands, ages 0-14. Derived using data from the Human Mortality Database. Calculations and methods
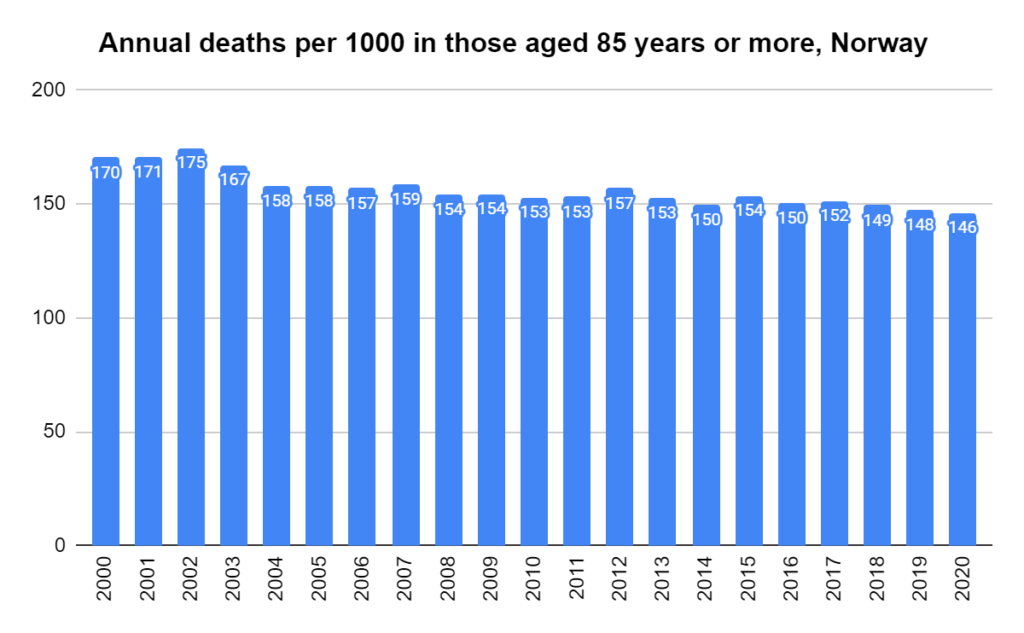
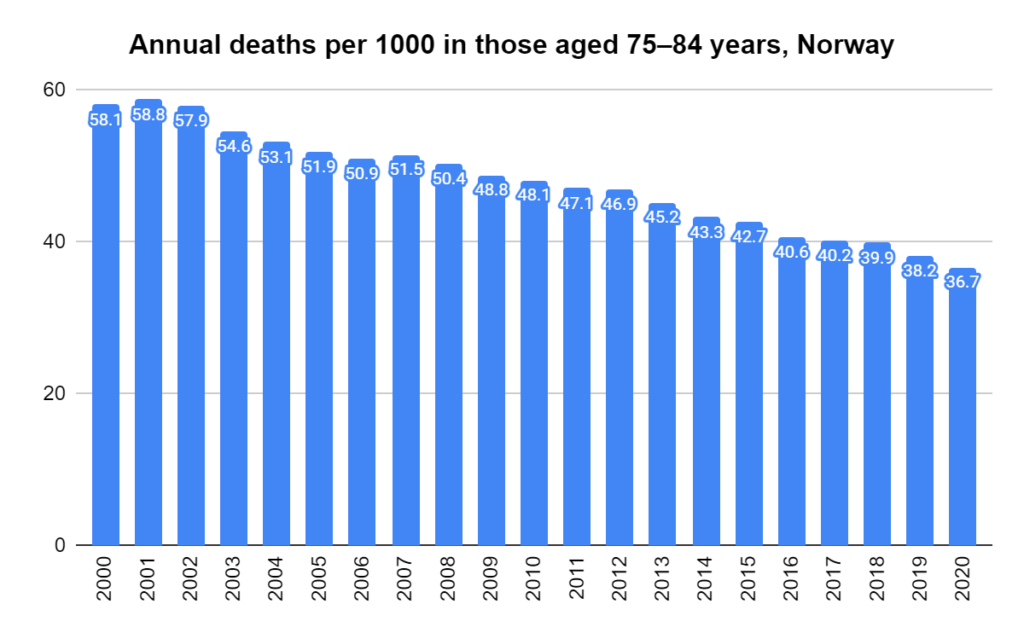
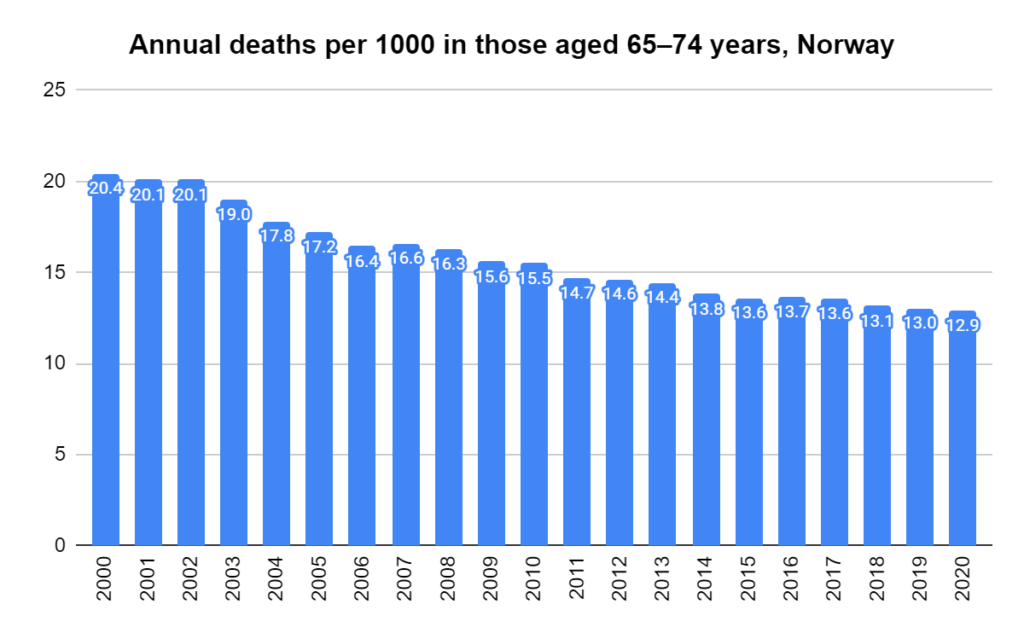
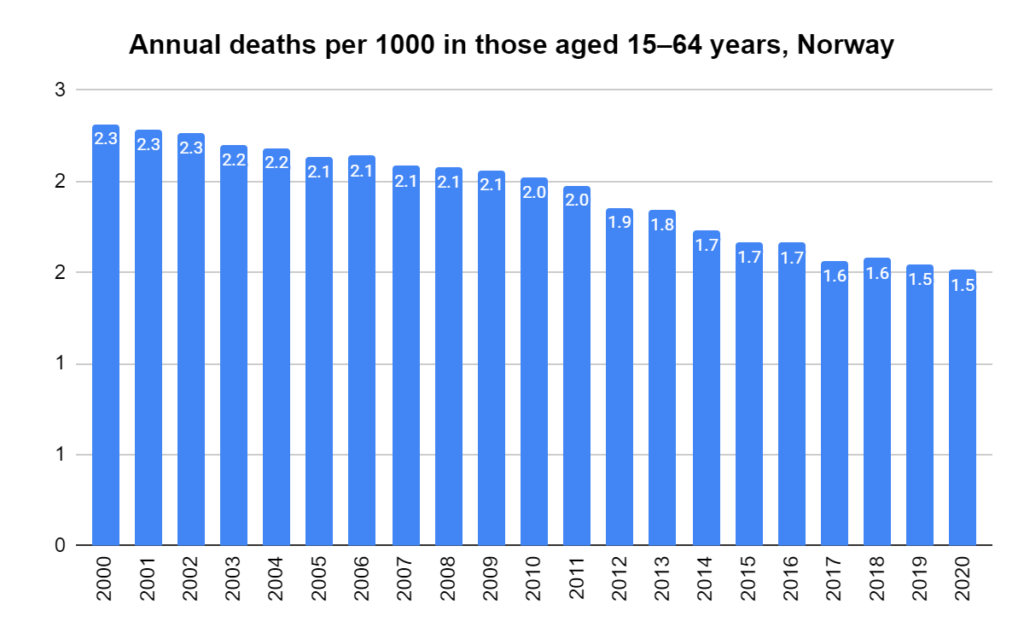
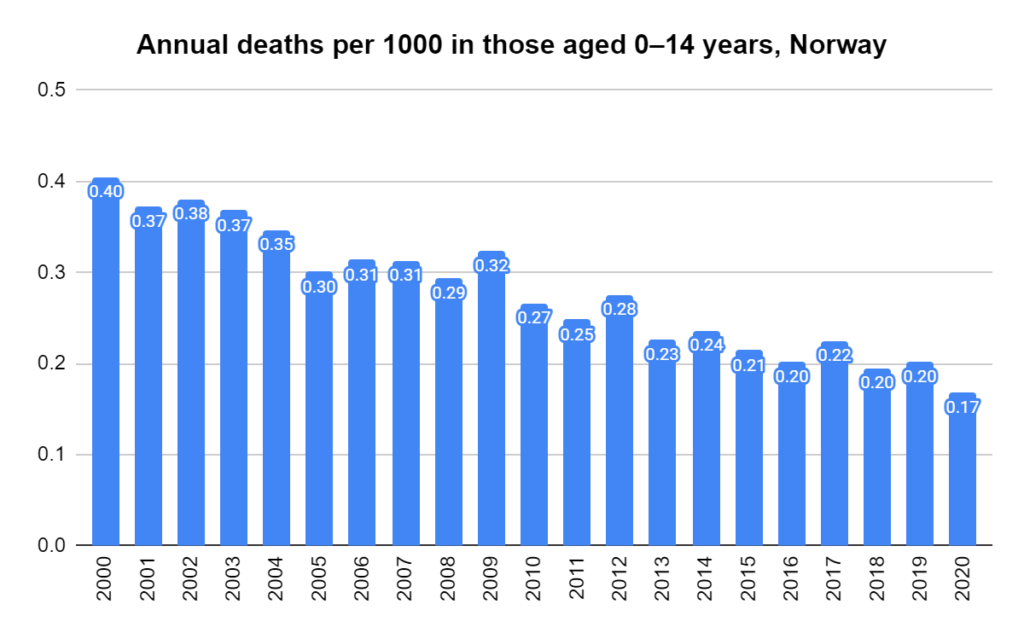
Deaths per 1000 per year in Norway, ages 85 years and over. Derived using data from the Human Mortality Database. Calculations and methodsDeaths per 1000 per year in Norway, ages 75-84. Derived using data from the Human Mortality Database. Calculations and methodsDeaths per 1000 per year in Norway, ages 65-74. Derived using data from the Human Mortality Database. Calculations and methodsDeaths per 1000 per year in Norway, ages 15-64. Derived using data from the Human Mortality Database. Calculations and methodsDeaths per 1000 per year in Norway, ages 0-14. Derived using data from the Human Mortality Database. Calculations and methods
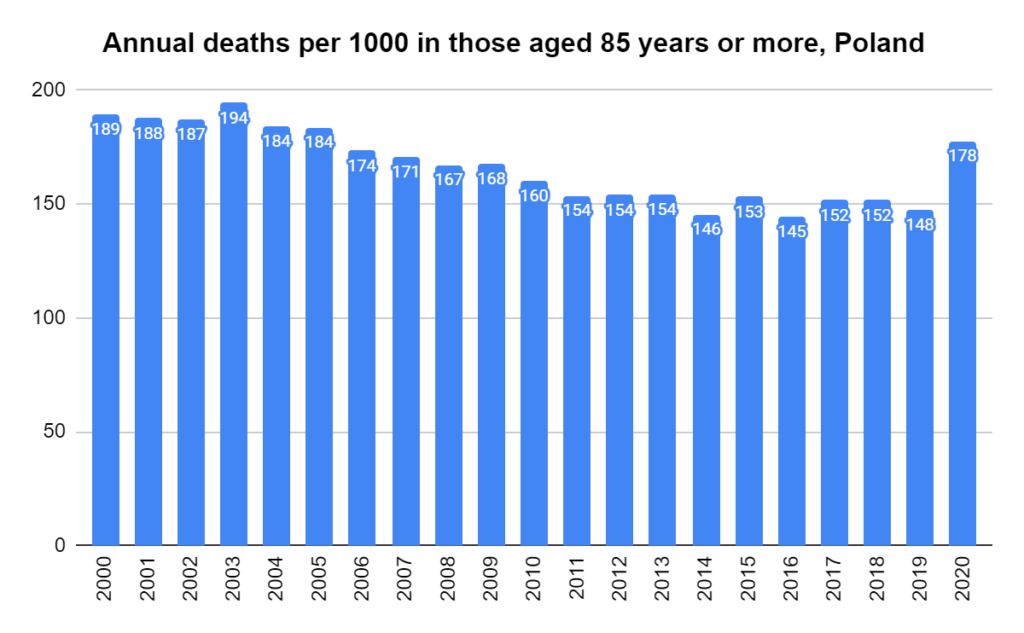
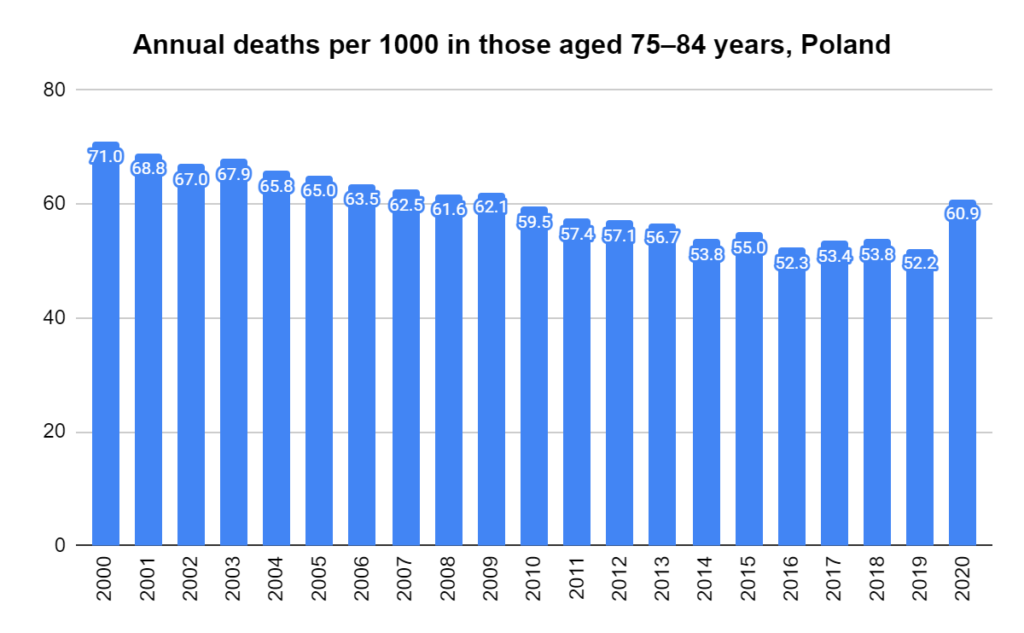
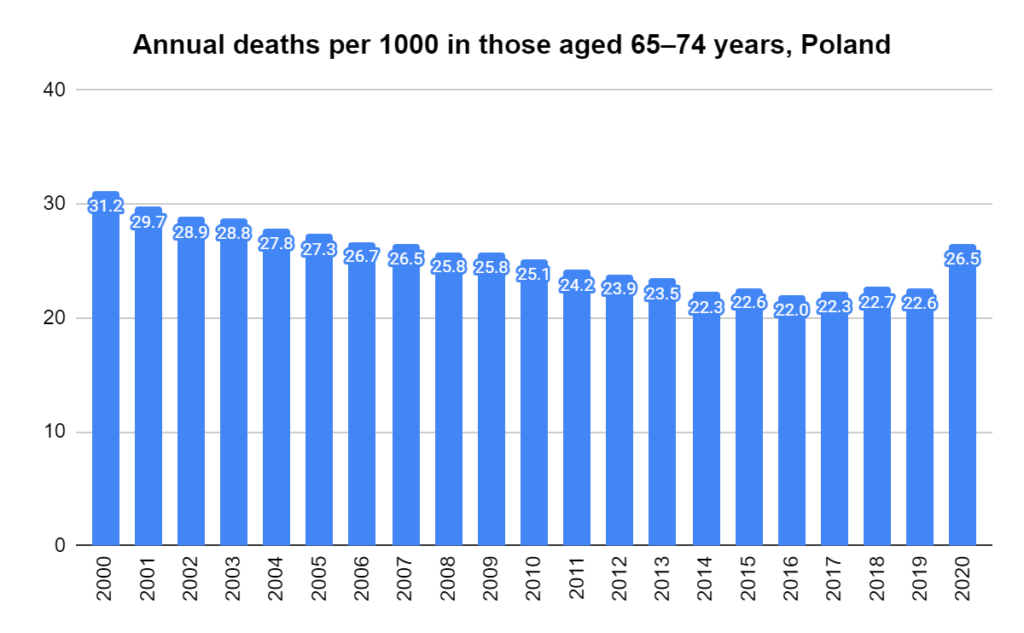
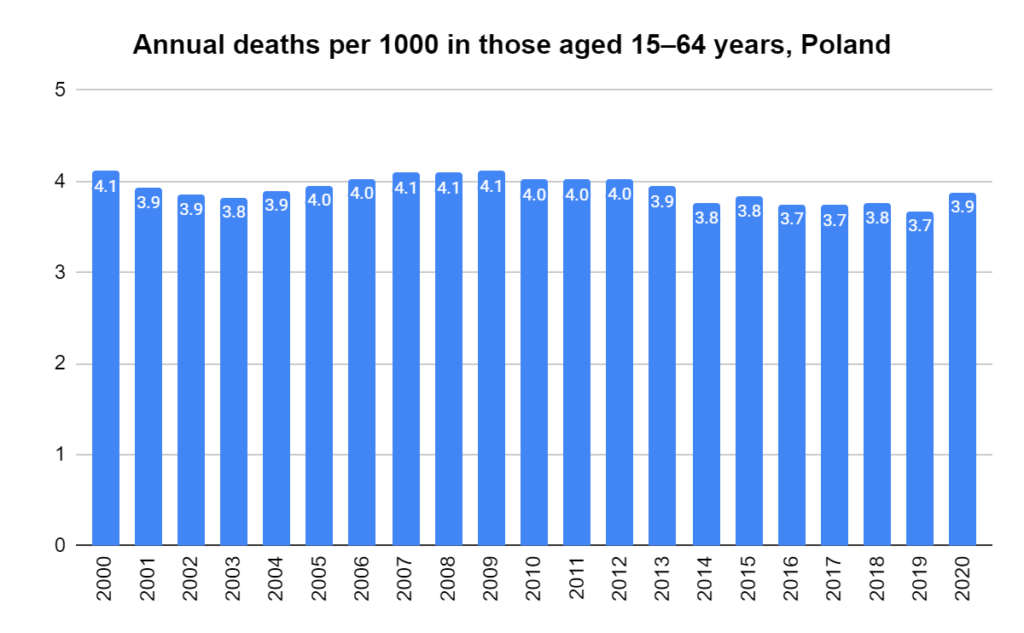
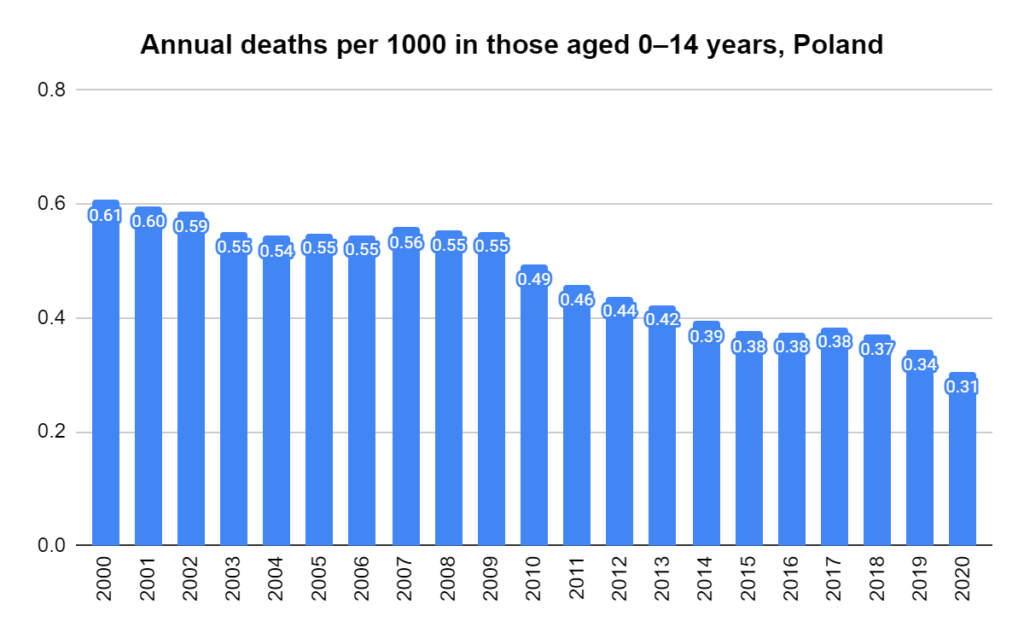
Deaths per 1000 per year in Poland, ages 85 years and over. Derived using data from the Human Mortality Database. Calculations and methodsDeaths per 1000 per year in Poland, ages 75-84. Derived using data from the Human Mortality Database. Calculations and methodsDeaths per 1000 per year in Poland, ages 65-74. Derived using data from the Human Mortality Database. Calculations and methodsDeaths per 1000 per year in Poland, ages 15-64. Derived using data from the Human Mortality Database. Calculations and methodsDeaths per 1000 per year in Poland, ages 0-14. Derived using data from the Human Mortality Database. Calculations and methods
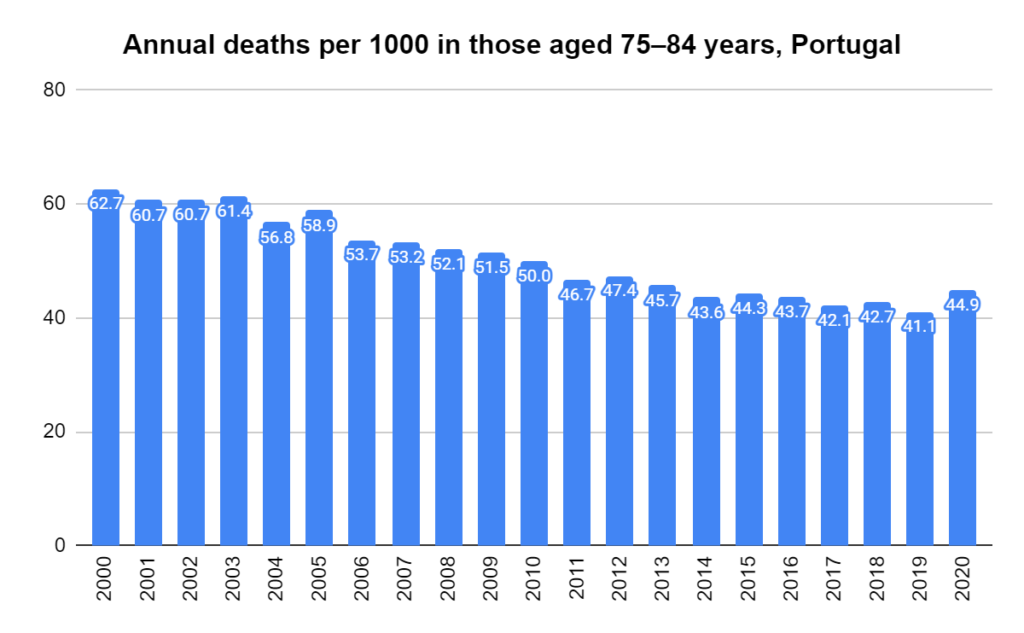
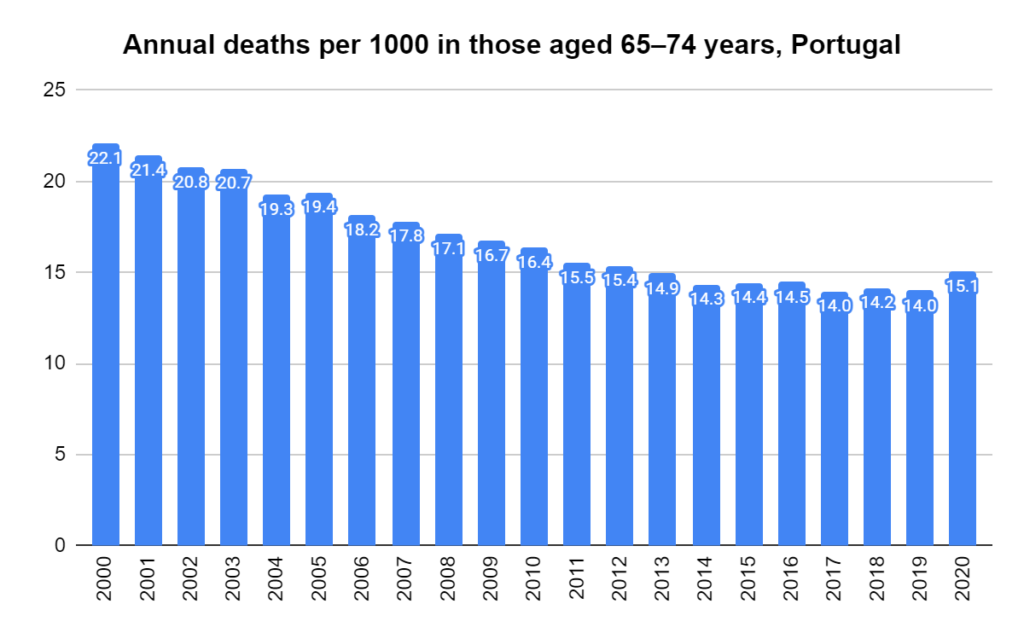
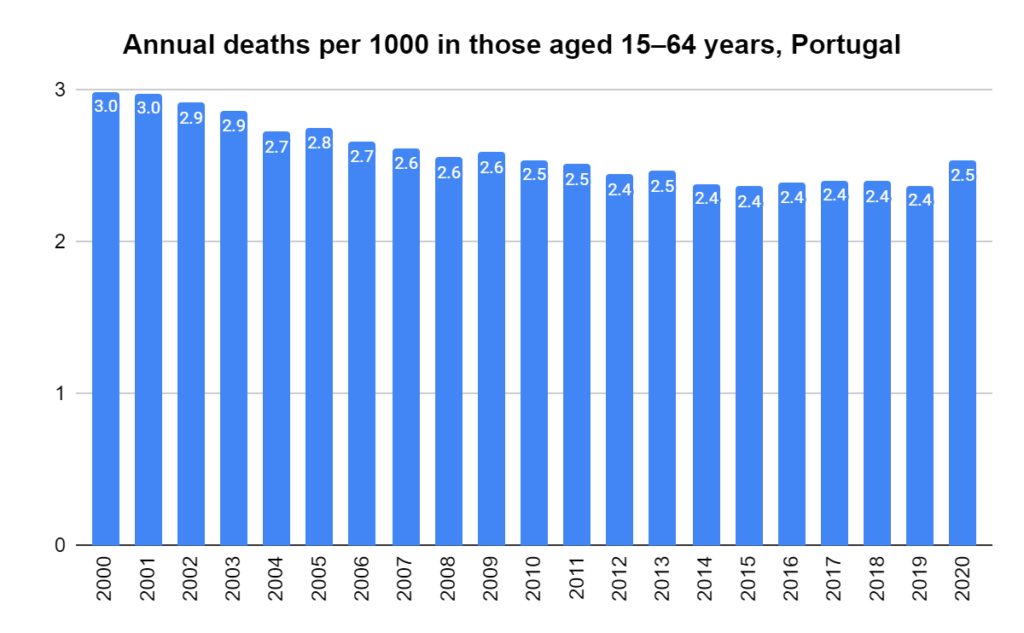
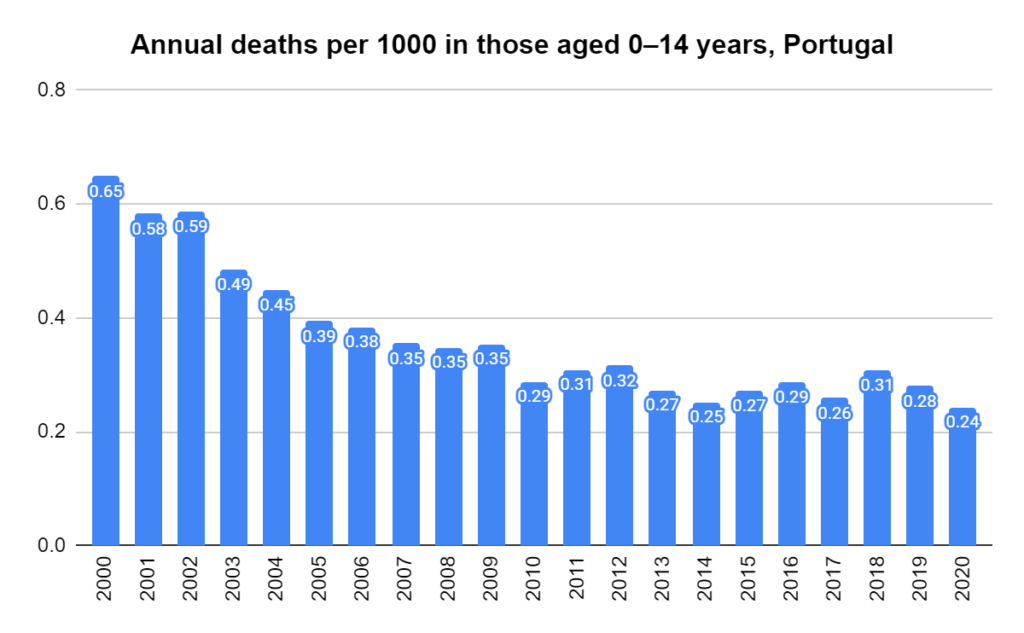
Deaths per 1000 per year in Portugal, ages 85 years and over. Derived using data from the Human Mortality Database. Calculations and methodsDeaths per 1000 per year in Portugal, ages 75-84. Derived using data from the Human Mortality Database. Calculations and methodsDeaths per 1000 per year in Portugal, ages 65-74. Derived using data from the Human Mortality Database. Calculations and methodsDeaths per 1000 per year in Portugal, ages 15-64. Derived using data from the Human Mortality Database. Calculations and methodsDeaths per 1000 per year in Portugal, ages 0-14. Derived using data from the Human Mortality Database. Calculations and methods
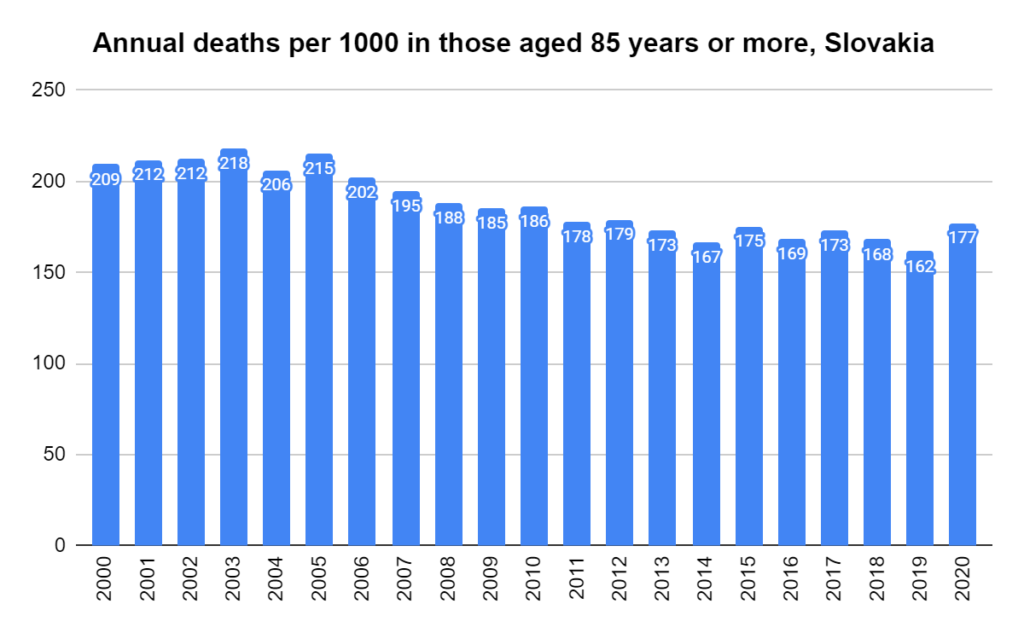
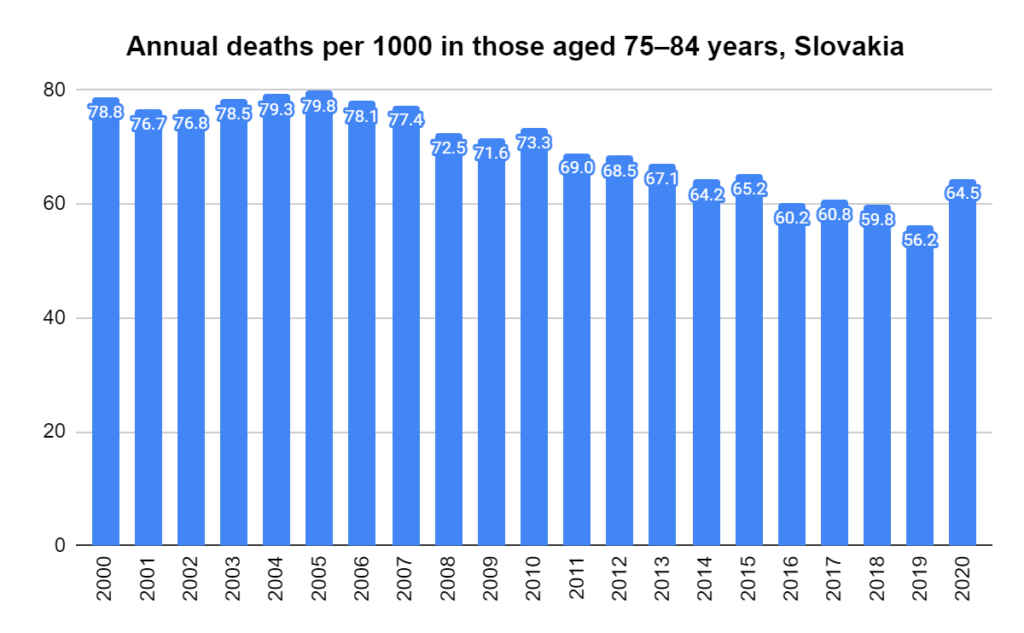
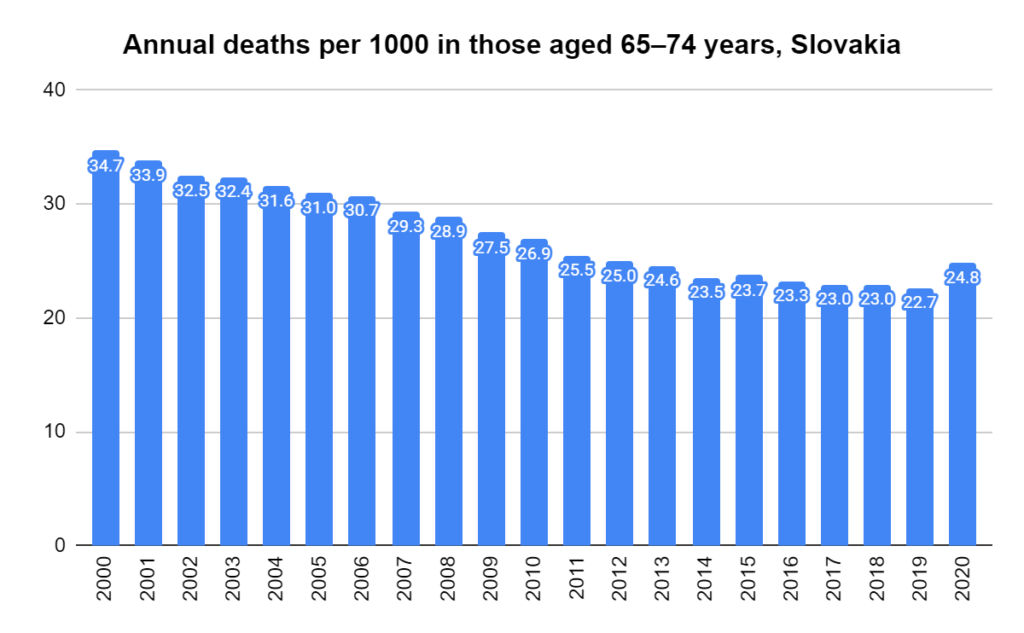
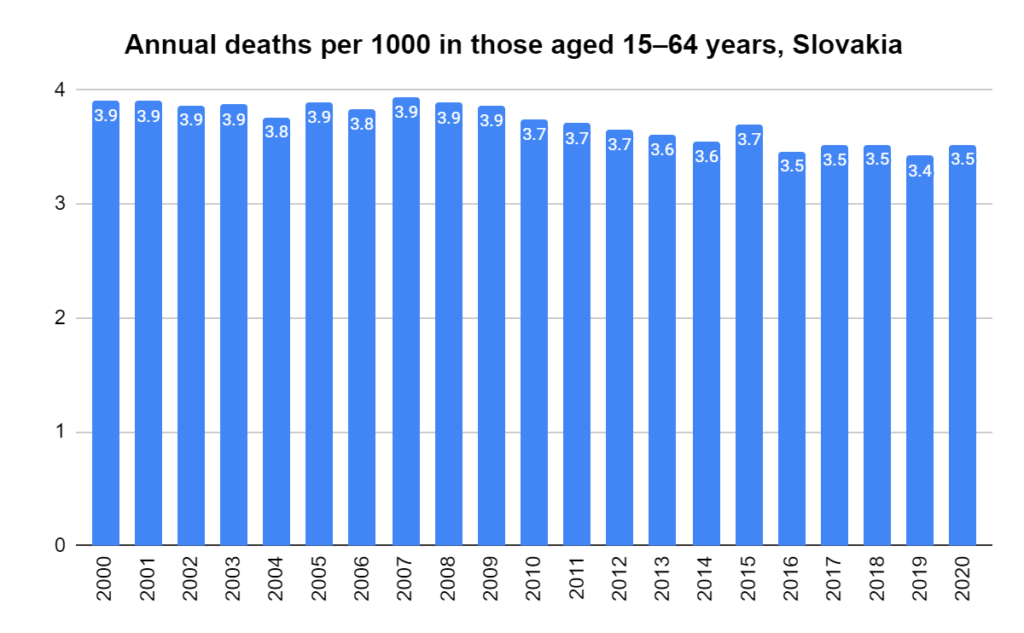
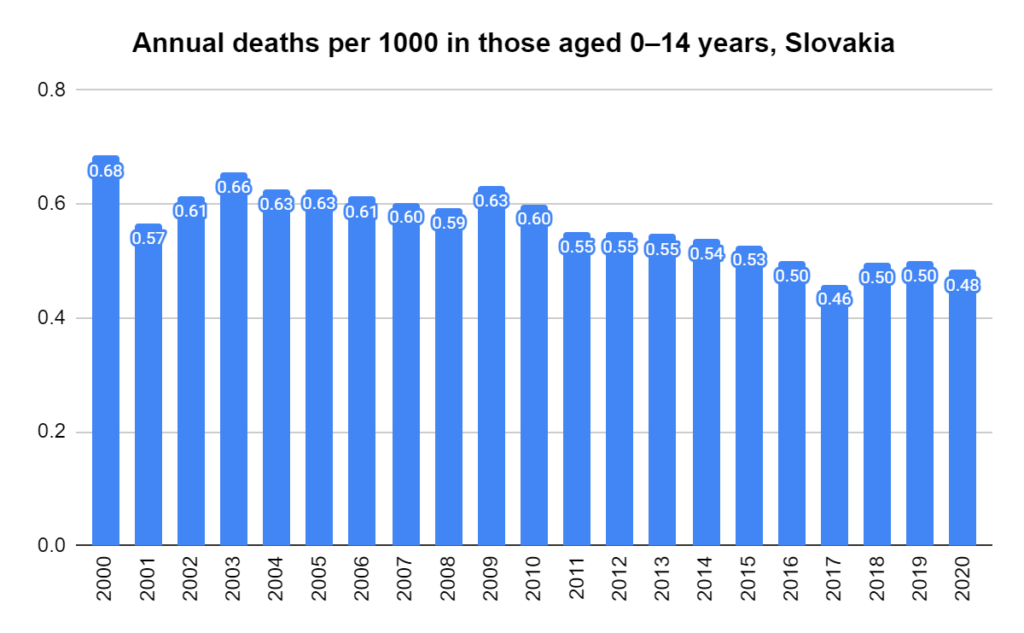
Deaths per 1000 per year in Slovakia, ages 85 years and over. Derived using data from the Human Mortality Database. Calculations and methodsDeaths per 1000 per year in Slovakia, ages 75-84. Derived using data from the Human Mortality Database. Calculations and methodsDeaths per 1000 per year in Slovakia, ages 65-74. Derived using data from the Human Mortality Database. Calculations and methodsDeaths per 1000 per year in Slovakia, ages 15-64. Derived using data from the Human Mortality Database. Calculations and methodsDeaths per 1000 per year in Slovakia, ages 0-14. Derived using data from the Human Mortality Database. Calculations and methods
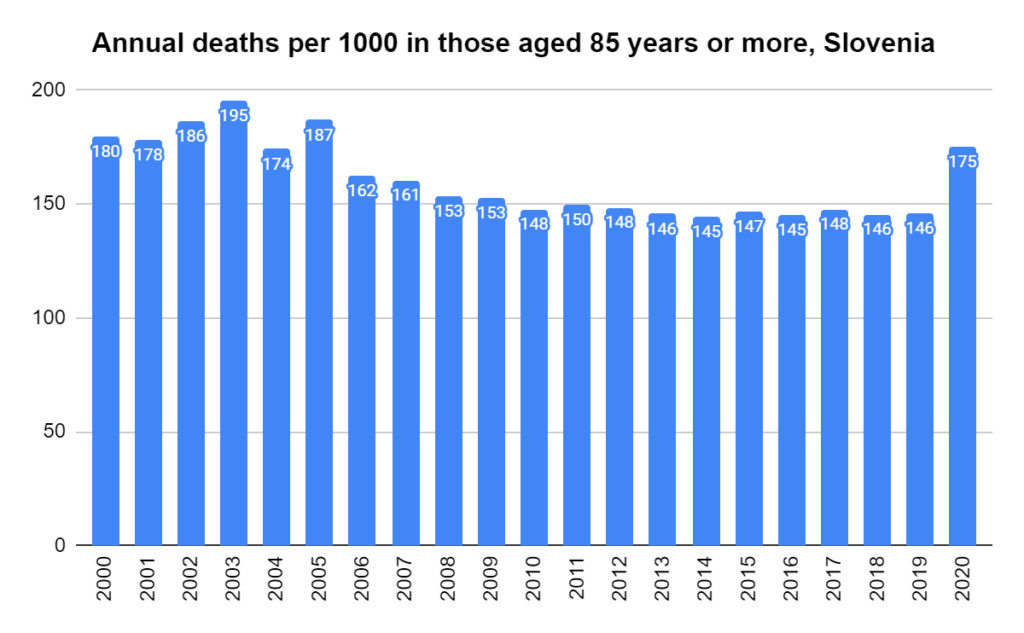
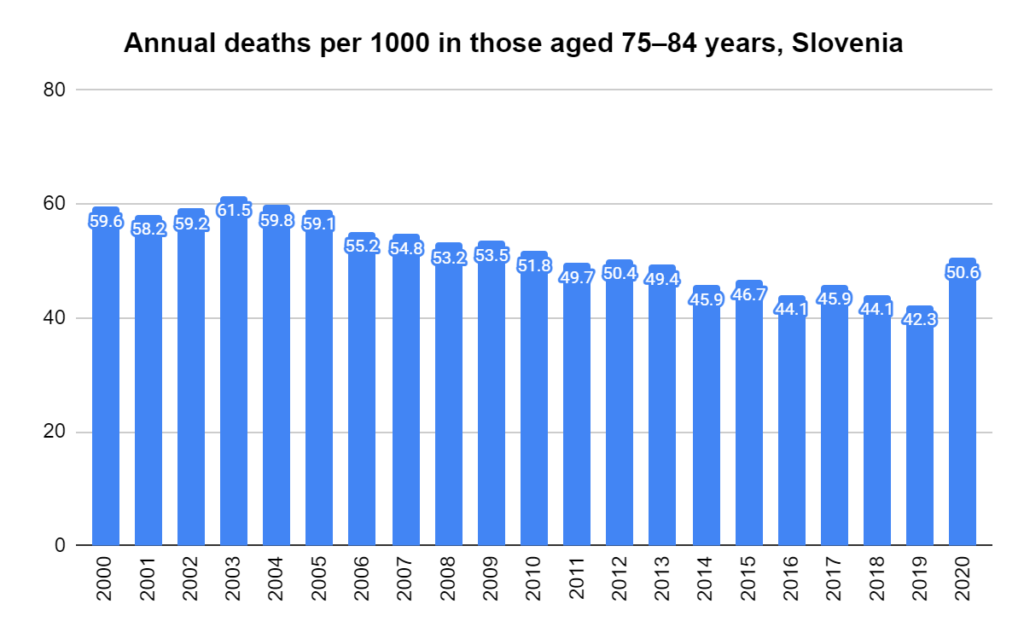
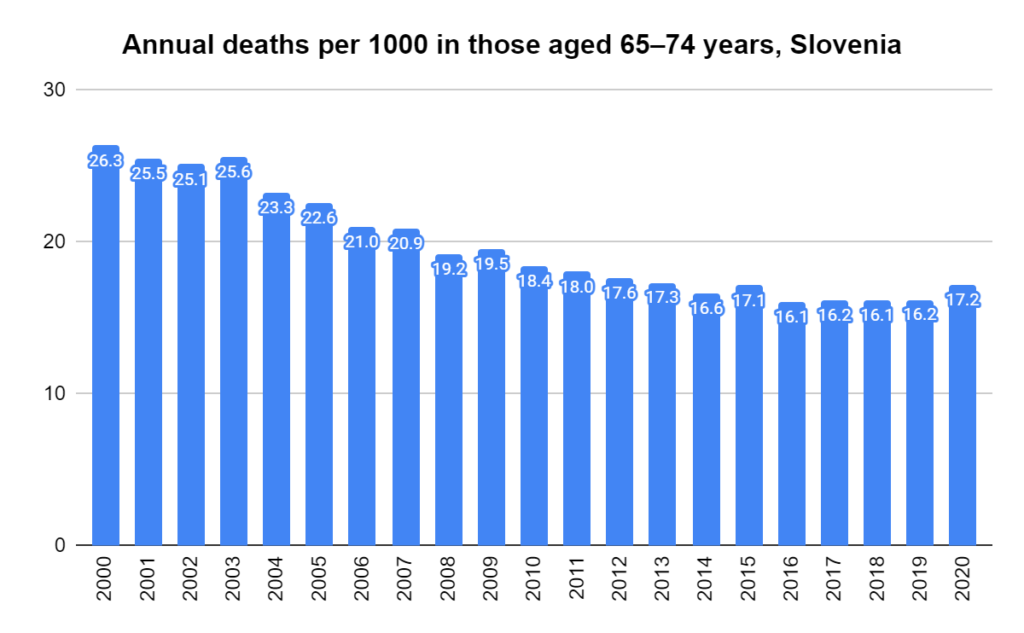
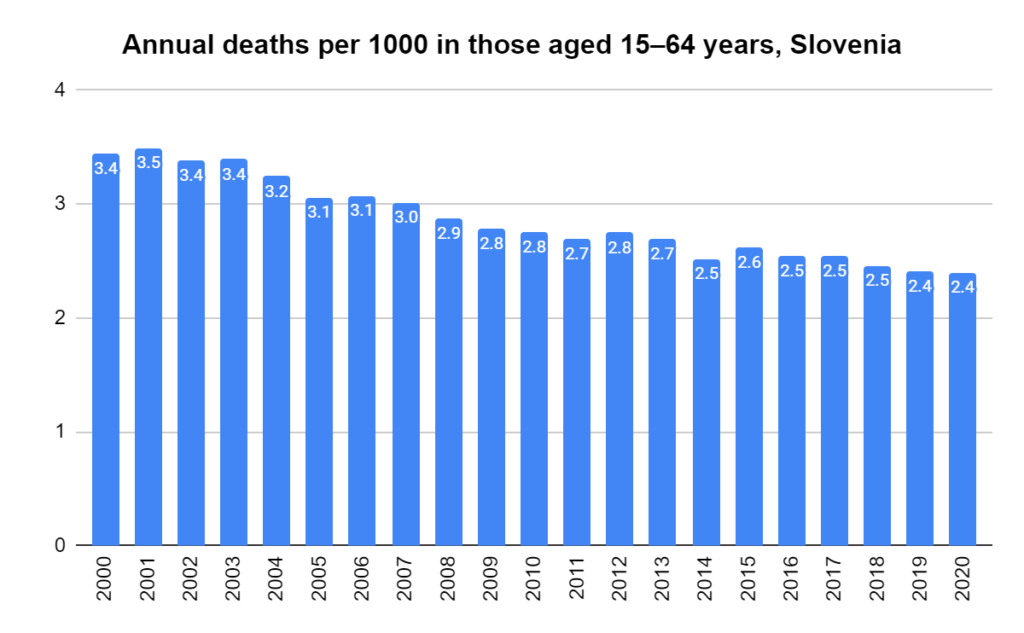
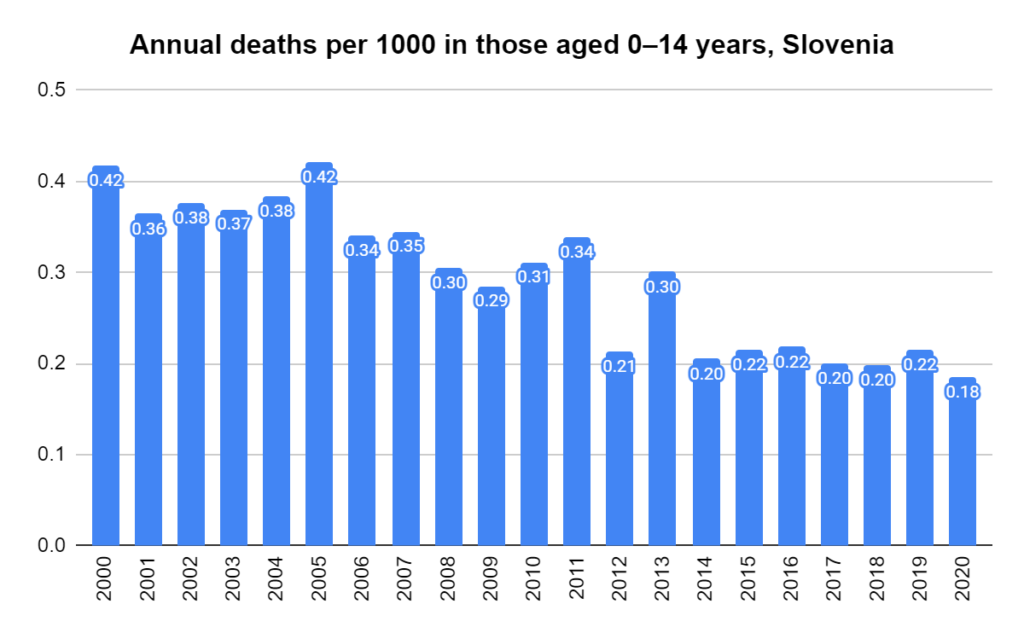
Deaths per 1000 per year in Slovenia, ages 85 years and over. Derived using data from the Human Mortality Database. Calculations and methodsDeaths per 1000 per year in Slovenia, ages 75-84. Derived using data from the Human Mortality Database. Calculations and methodsDeaths per 1000 per year in Slovenia, ages 65-74. Derived using data from the Human Mortality Database. Calculations and methodsDeaths per 1000 per year in Slovenia, ages 15-64. Derived using data from the Human Mortality Database. Calculations and methodsDeaths per 1000 per year in Slovenia, ages 0-14. Derived using data from the Human Mortality Database. Calculations and methods
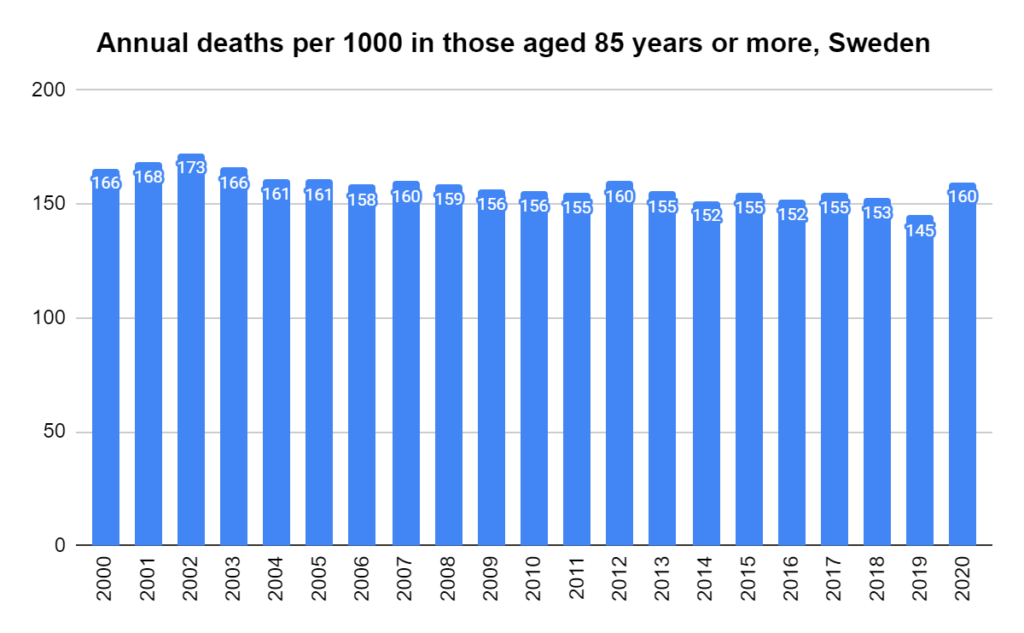
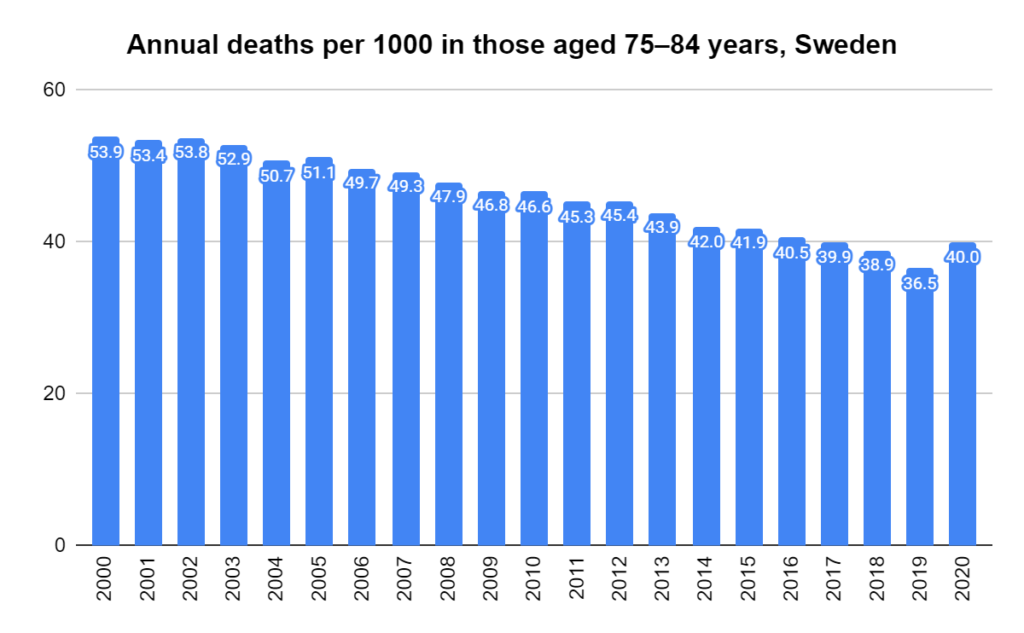
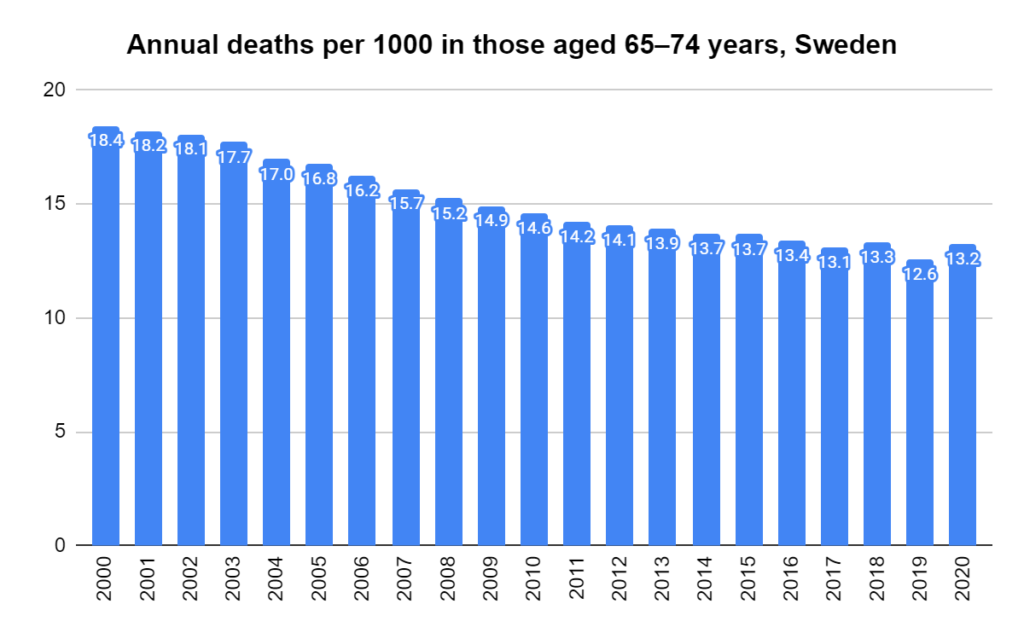
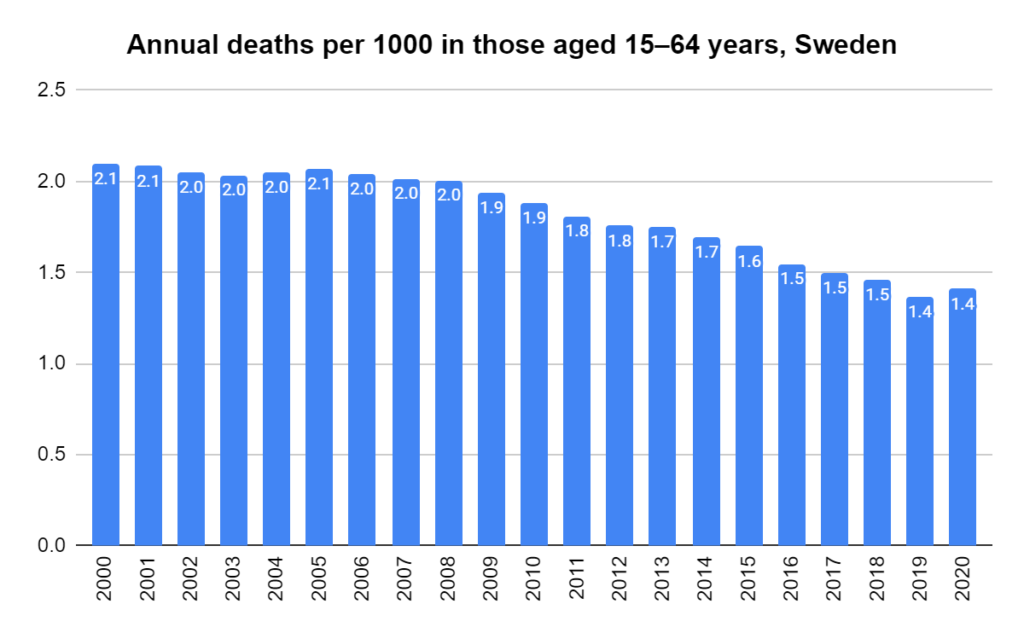
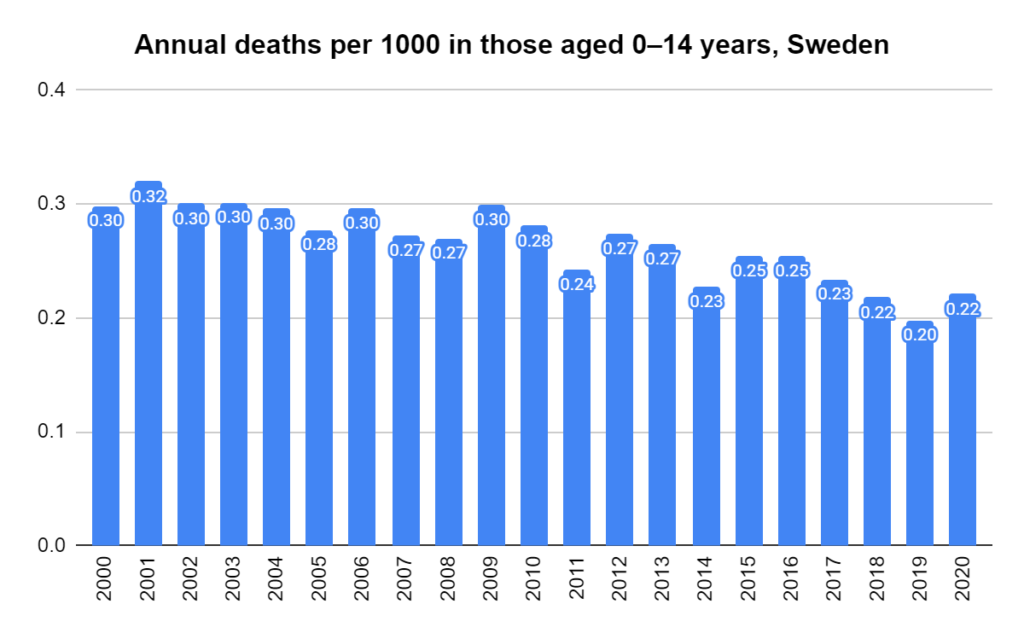
Deaths per 1000 per year in Sweden, ages 85 years and over. Derived using data from the Human Mortality Database. Calculations and methodsDeaths per 1000 per year in Sweden, ages 75-84. Derived using data from the Human Mortality Database. Calculations and methodsDeaths per 1000 per year in Sweden, ages 65-74. Derived using data from the Human Mortality Database. Calculations and methodsDeaths per 1000 per year in Sweden, ages 15-64. Derived using data from the Human Mortality Database. Calculations and methodsDeaths per 1000 per year in Sweden, ages 0-14. Derived using data from the Human Mortality Database. Calculations and methods
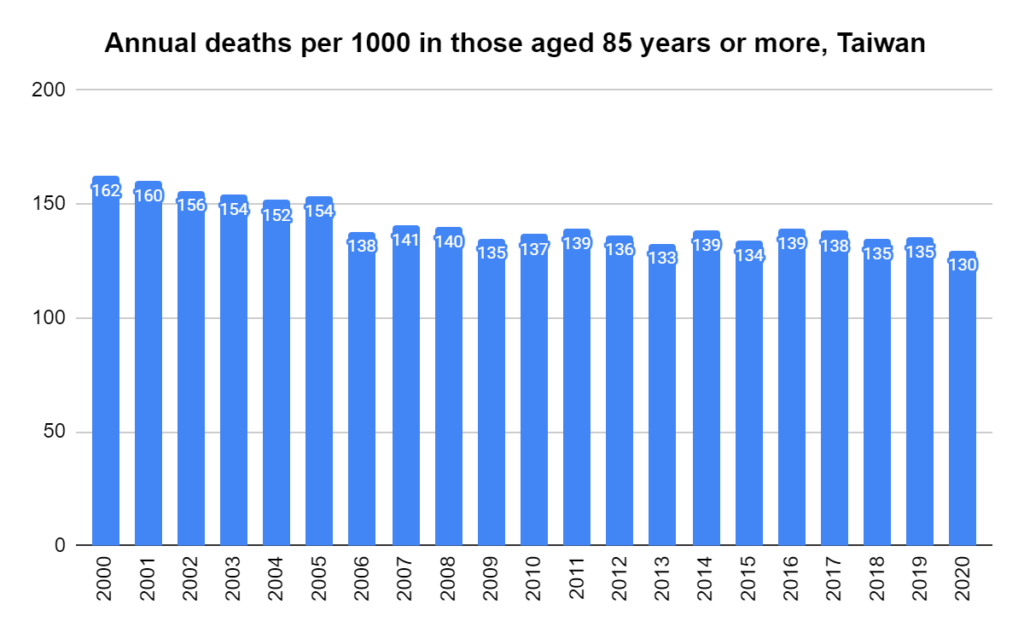
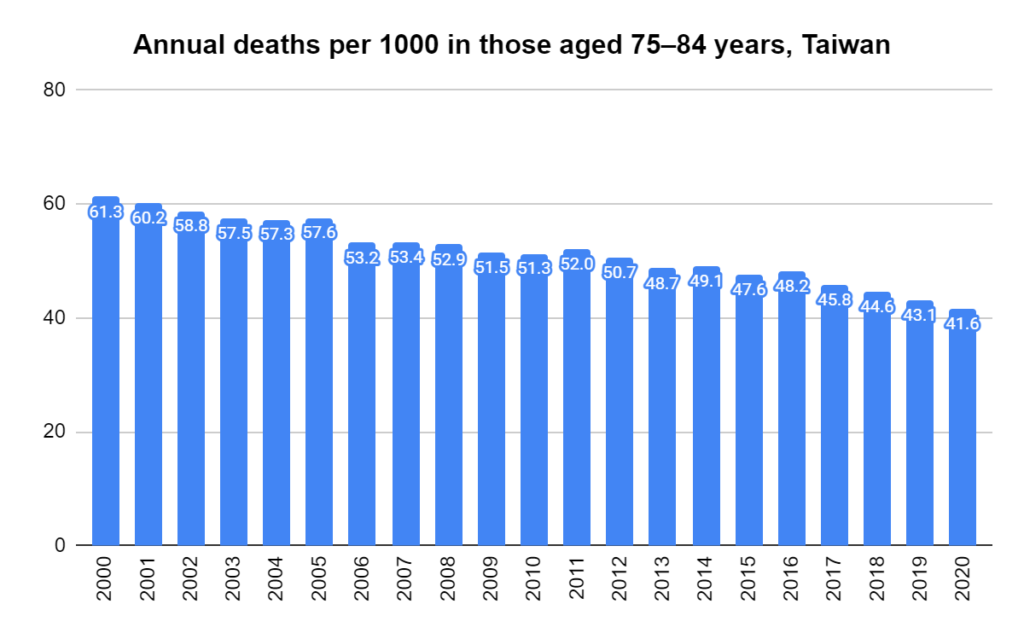
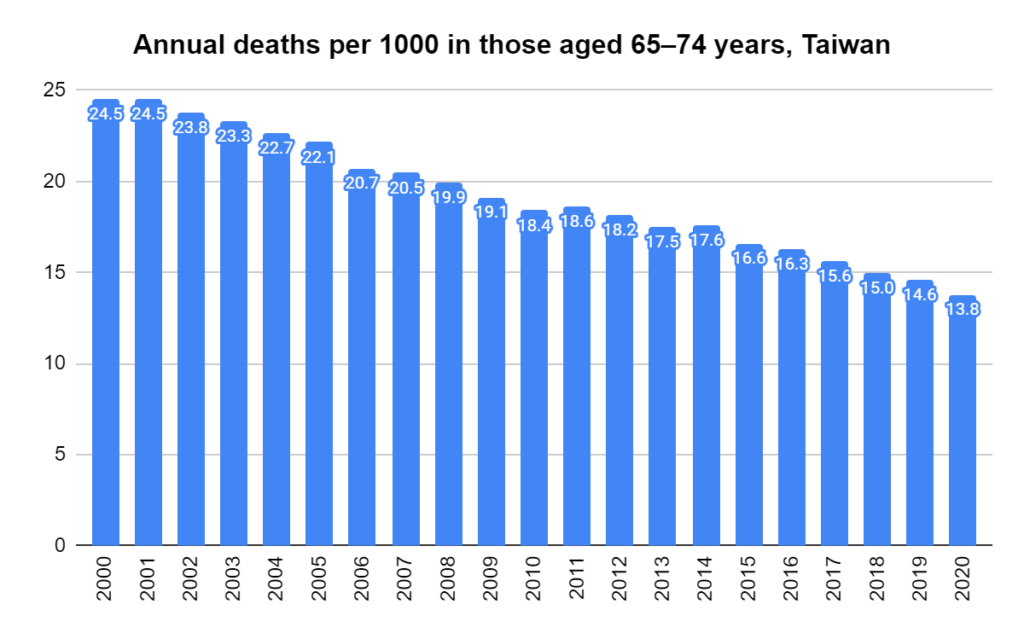
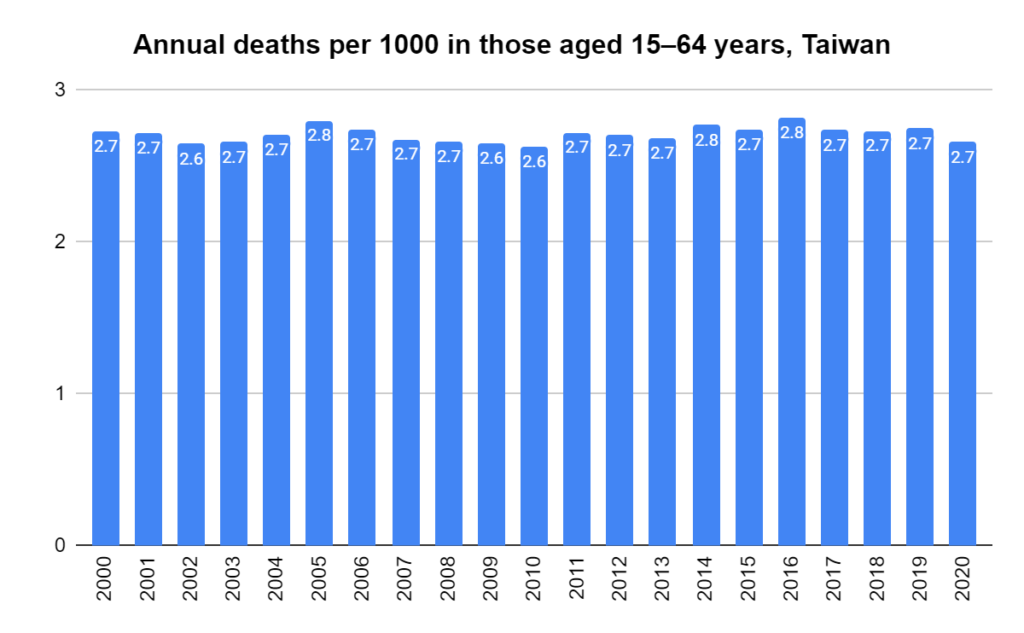
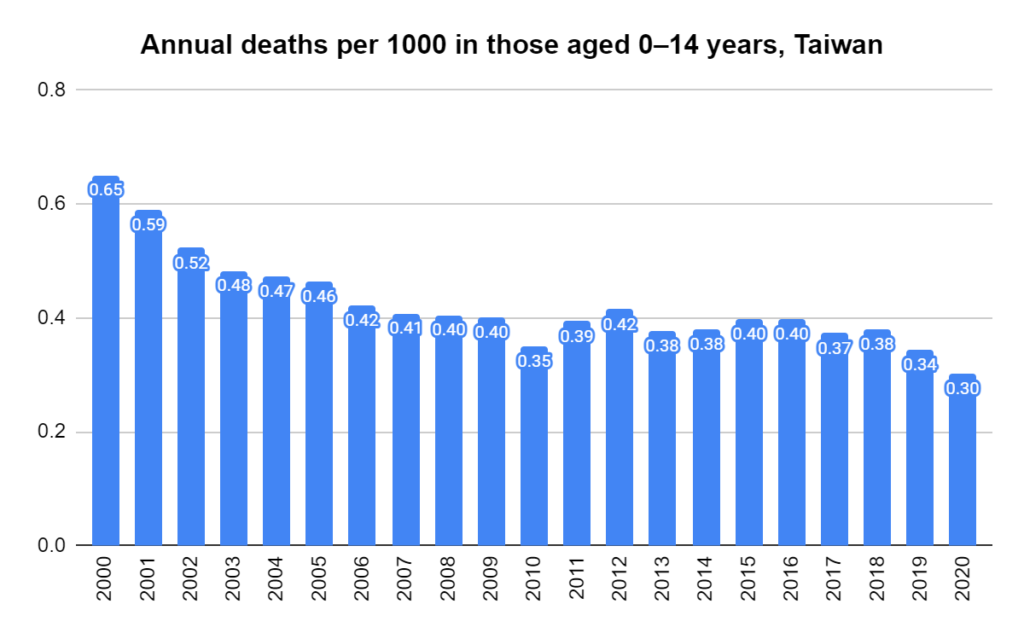
Deaths per 1000 per year in Taiwan, ages 85 years and over. Derived using data from the Human Mortality Database. Calculations and methodsDeaths per 1000 per year in Taiwan, ages 75-84. Derived using data from the Human Mortality Database. Calculations and methodsDeaths per 1000 per year in Taiwan, ages 65-74. Derived using data from the Human Mortality Database. Calculations and methodsDeaths per 1000 per year in Taiwan, ages 15-64. Derived using data from the Human Mortality Database. Calculations and methodsDeaths per 1000 per year in Taiwan, ages 0-14. Derived using data from the Human Mortality Database. Calculations and methods